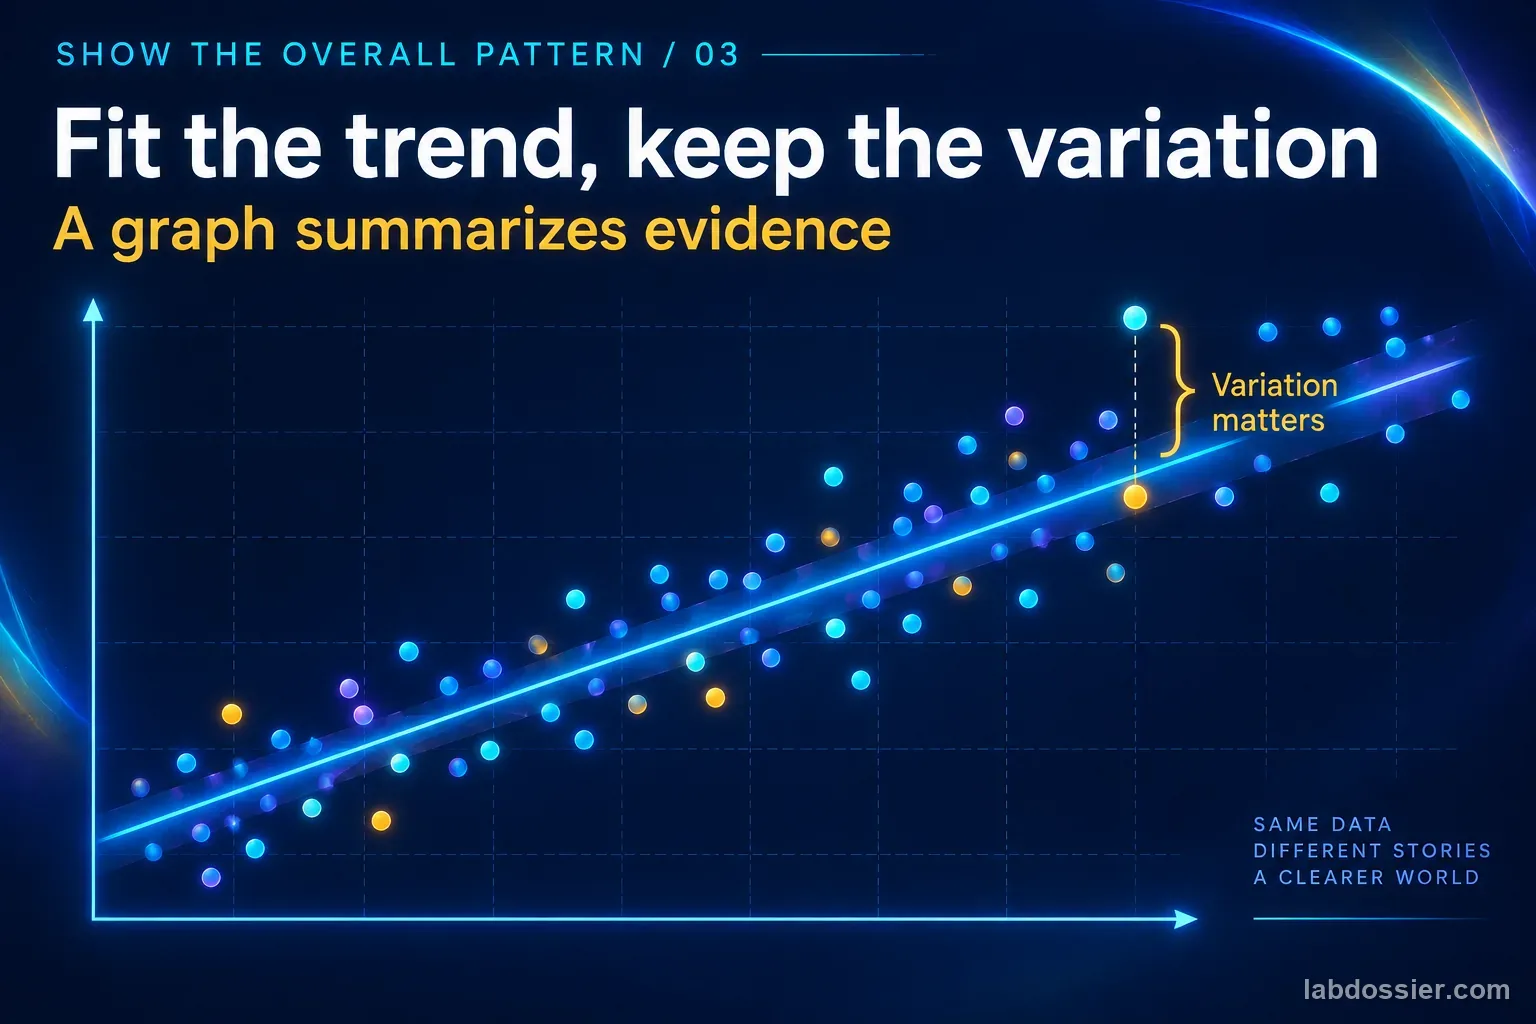
What explains the result?
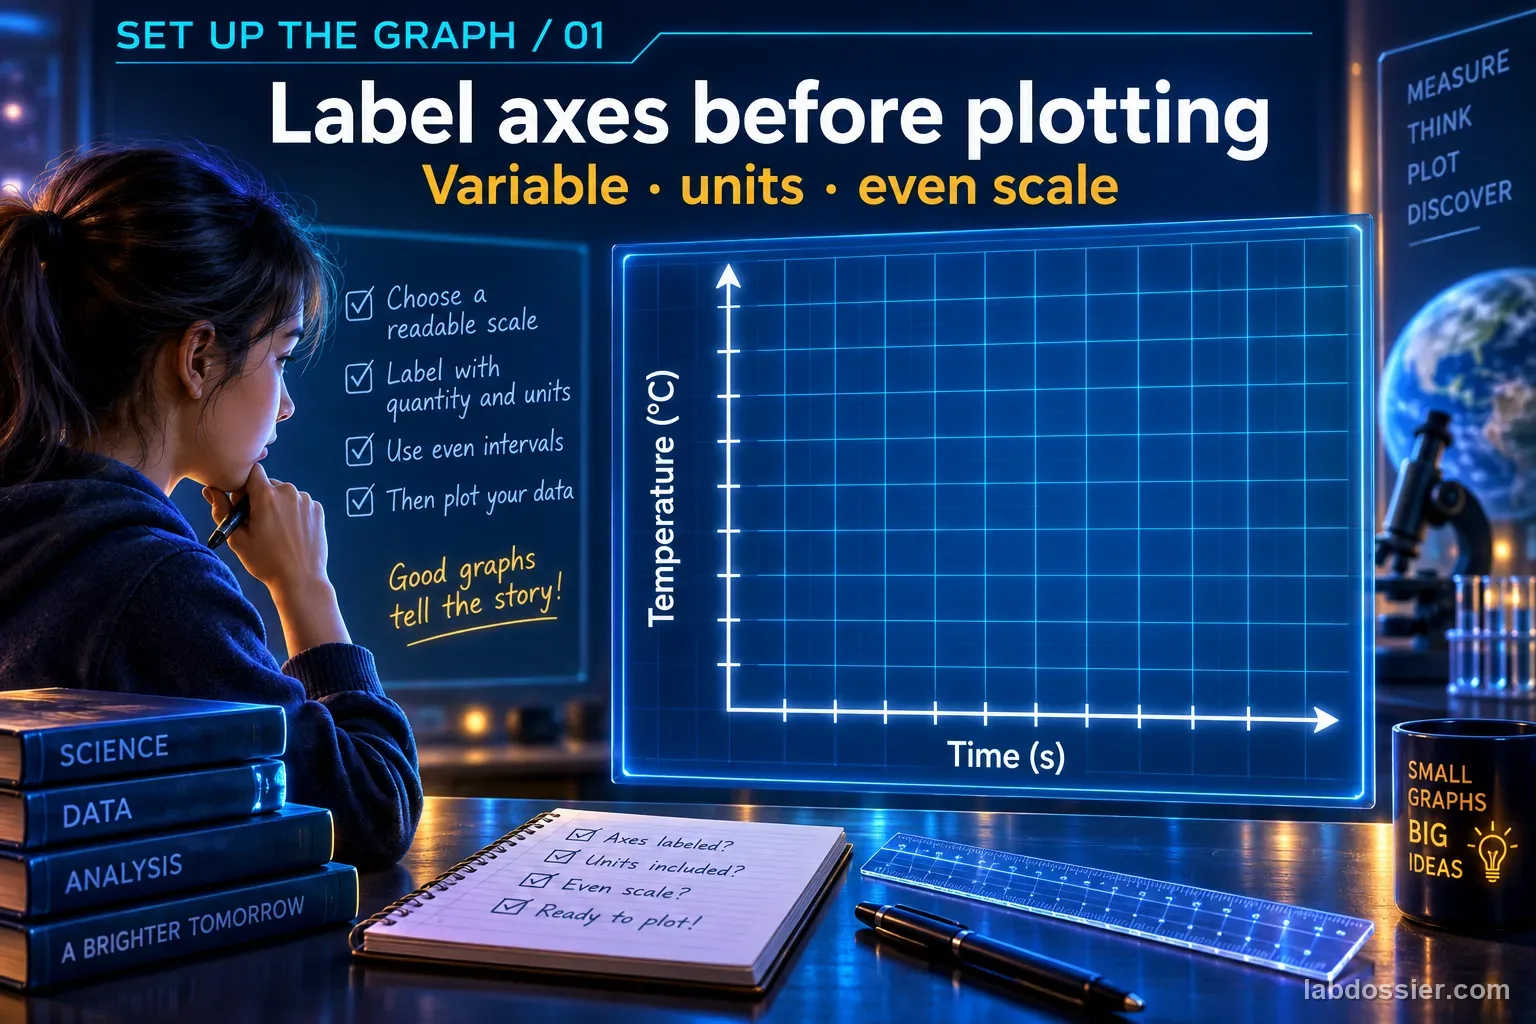
An honest graph uses consistent intervals, labels both variables, and includes units so readers can interpret the pattern.
LAB SKILLS · GRADES 4–12
INVESTIGATION QUESTIONWhich axis scale makes the measured trend readable without distorting it?
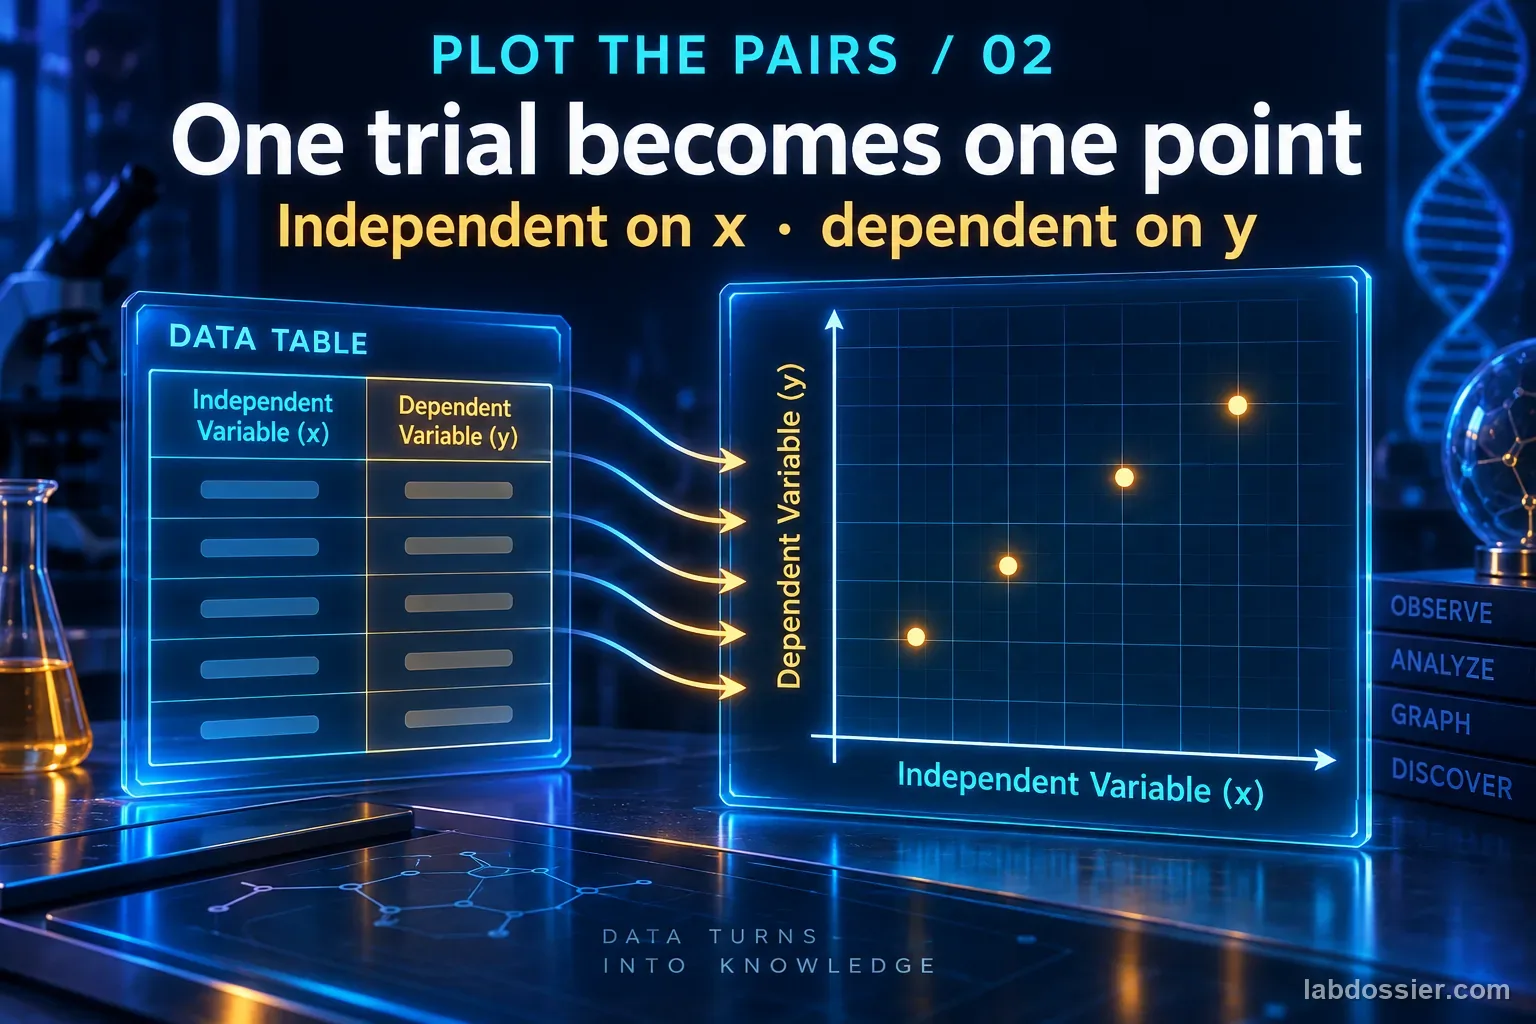
Put the assigned factor on the horizontal axis, response on vertical.
An honest graph uses consistent intervals, labels both variables, and includes units so readers can interpret the pattern.
Clear graphs help students, field researchers, and engineers compare measurements without hiding variation.
A readable graph does not establish causation; the sampling and experiment design still matter.
DEDICATED PRACTICE ROOM · LAB SKILLS
Which axis scale makes the measured trend readable without distorting it?

Plot each paired measurement from the data strip. Only after all five points appear, interpret their direction. A readable graph does not establish causation; the sampling and experiment design still matter.
0 / 5 measurements plotted
An honest graph uses consistent intervals, labels both variables, and includes units so readers can interpret the pattern.
Clear graphs help students, field researchers, and engineers compare measurements without hiding variation.
MODEL LIMIT A readable graph does not establish causation; the sampling and experiment design still matter. The activities on this page do not store classroom measurements.