Lab files
Every lab file follows the same structure: question, variables, hypothesis, procedure, data table, and what to expect — plus a printable data sheet with an answer key.
Want to browse by topic or grade band? Explore the science collection. For a deeper concept explainer, see how nuclear transmutation differs from chemistry.
Build a density column in the virtual lab
Arrange the liquids, make a prediction, and test where each object settles.
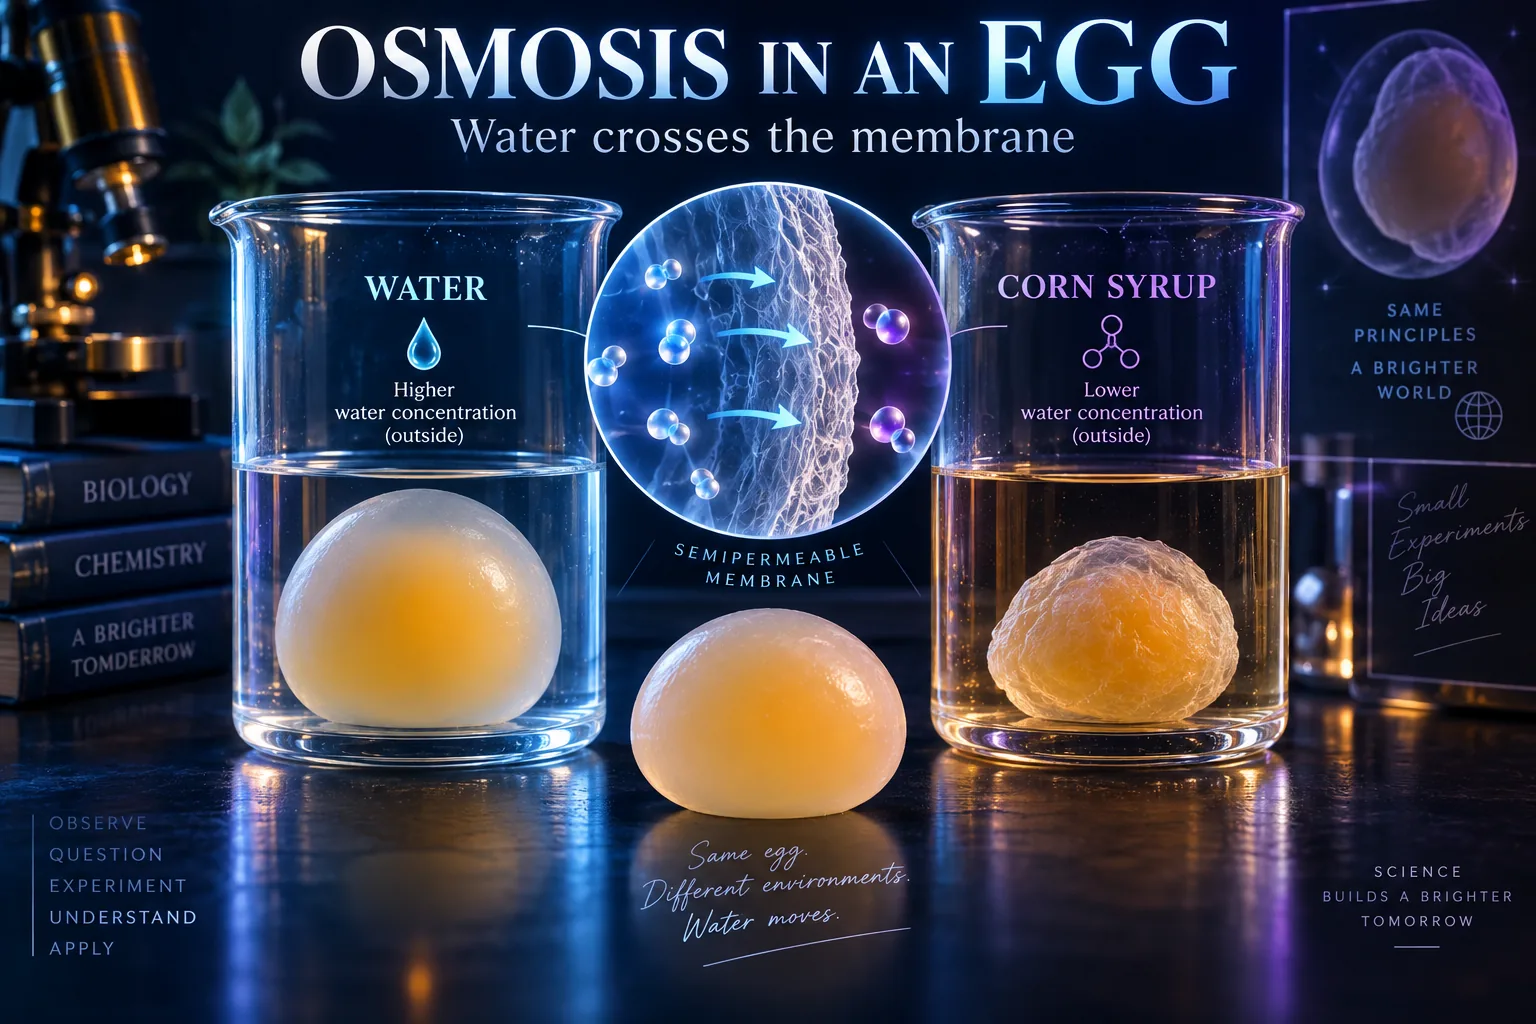
Osmosis egg lab
Try an egg osmosis experiment: soak a shell-less egg in water and corn syrup, measure mass change, and explain the direction water moves in this lab.
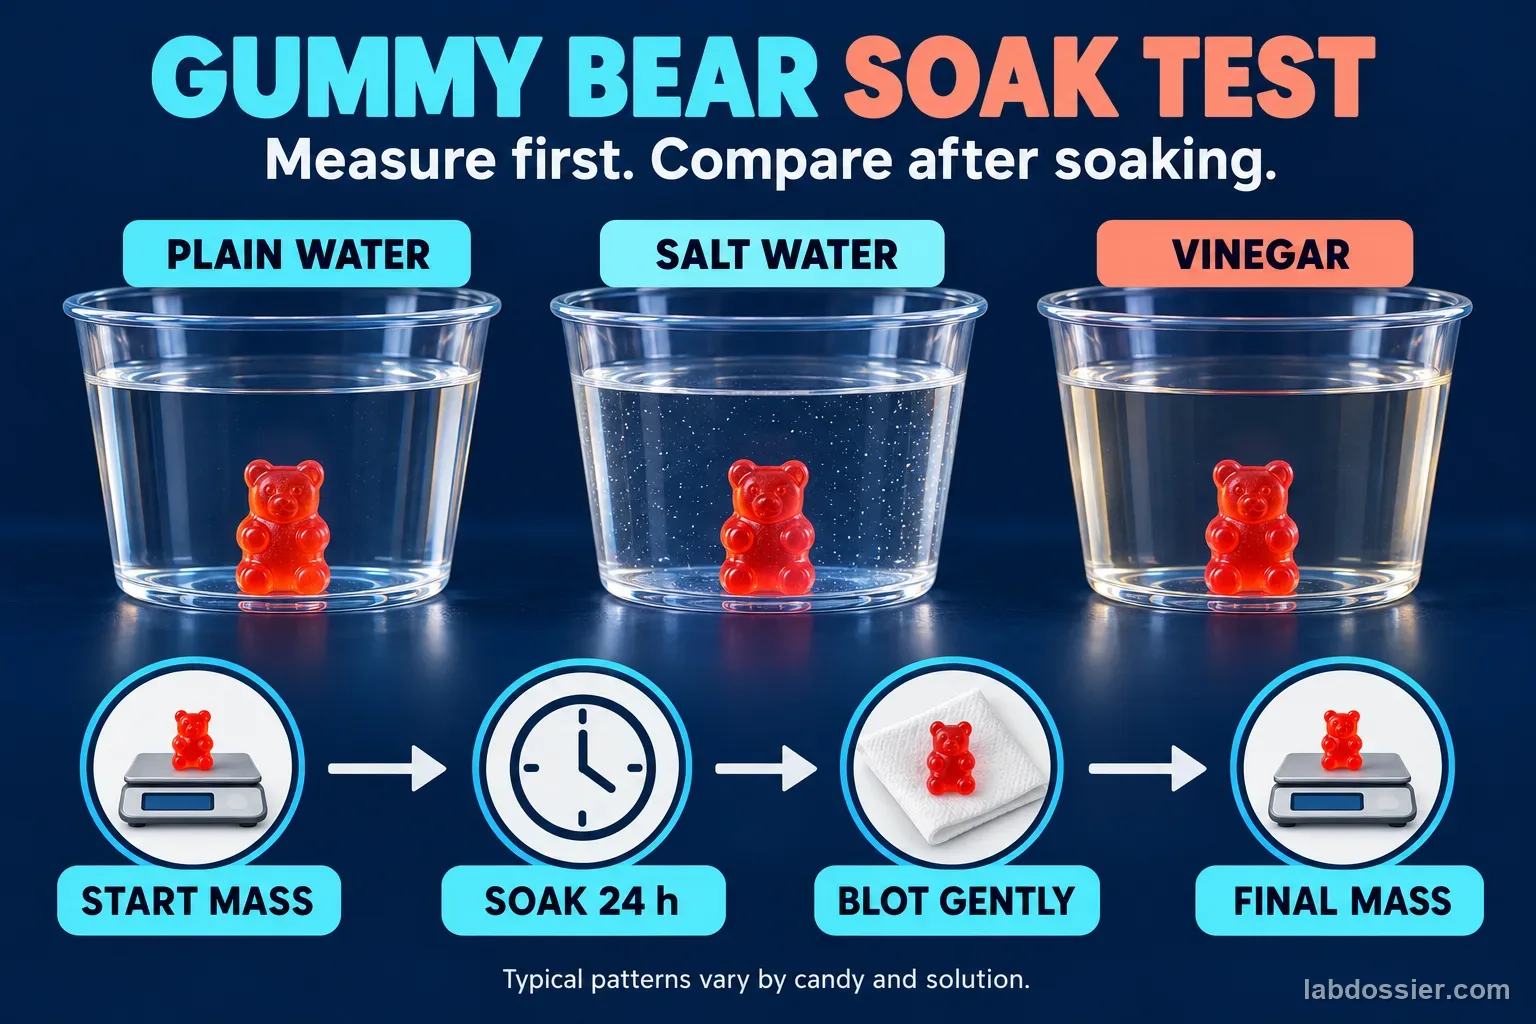
Gummy bear osmosis
Run a gummy bear osmosis experiment with water, salt water and vinegar; compare mass and size while accounting for gelatin’s limits as a cell model.
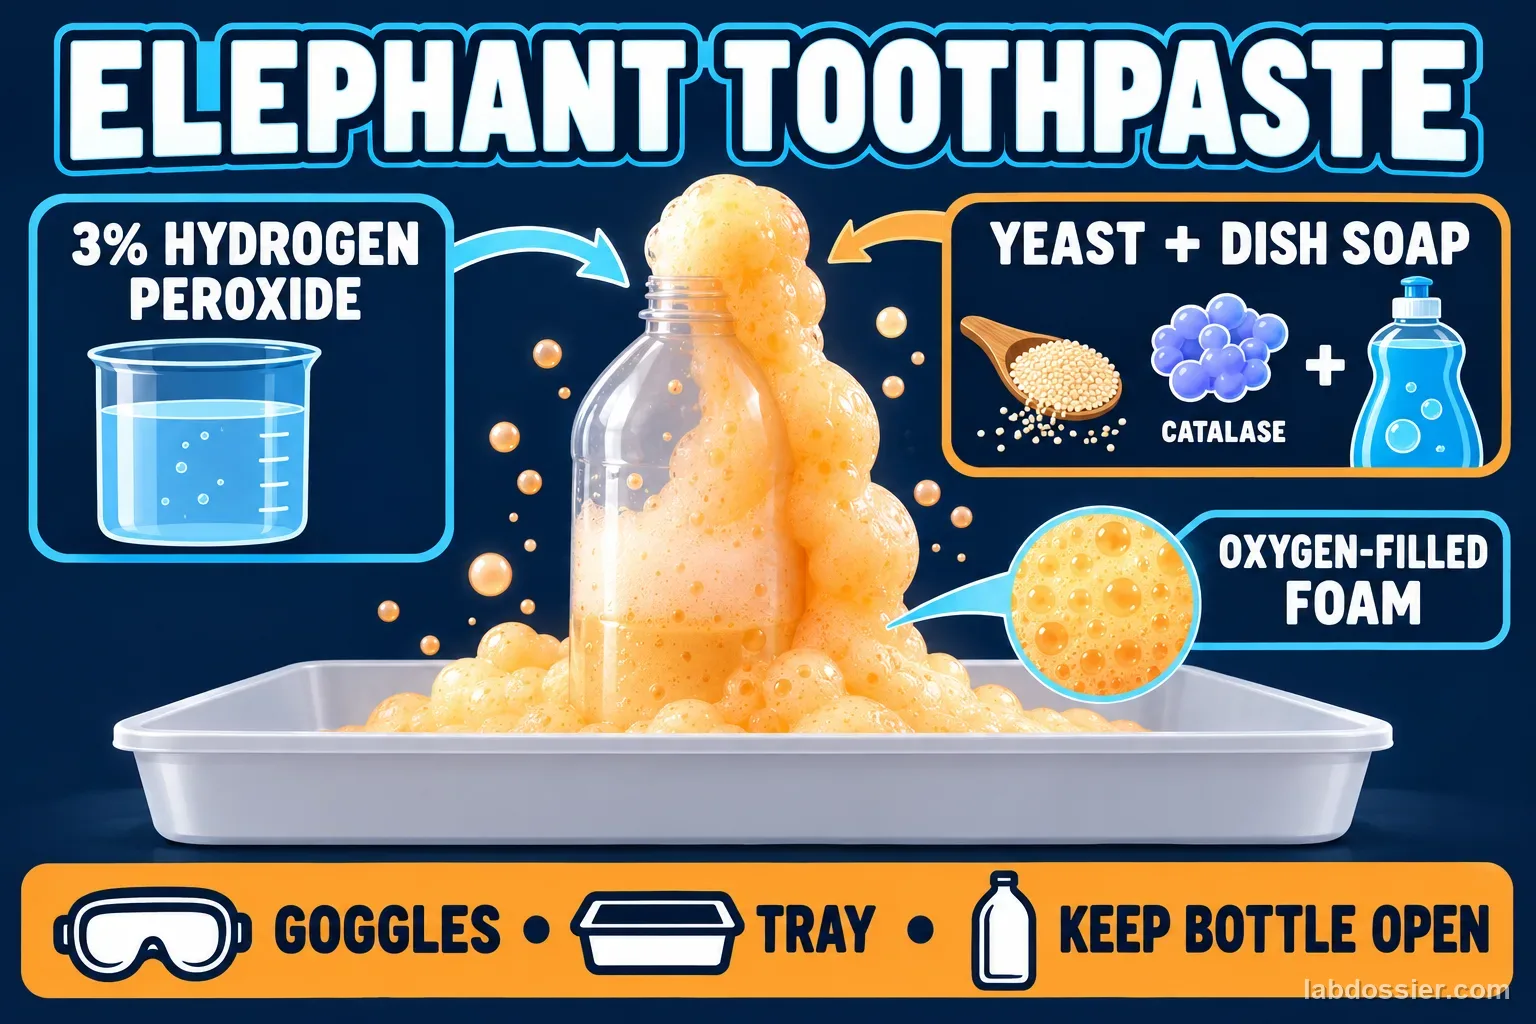
Elephant toothpaste
Compare yeast amounts in elephant-toothpaste trials, keep peroxide and other conditions matched, and measure foam rise time and height in class.
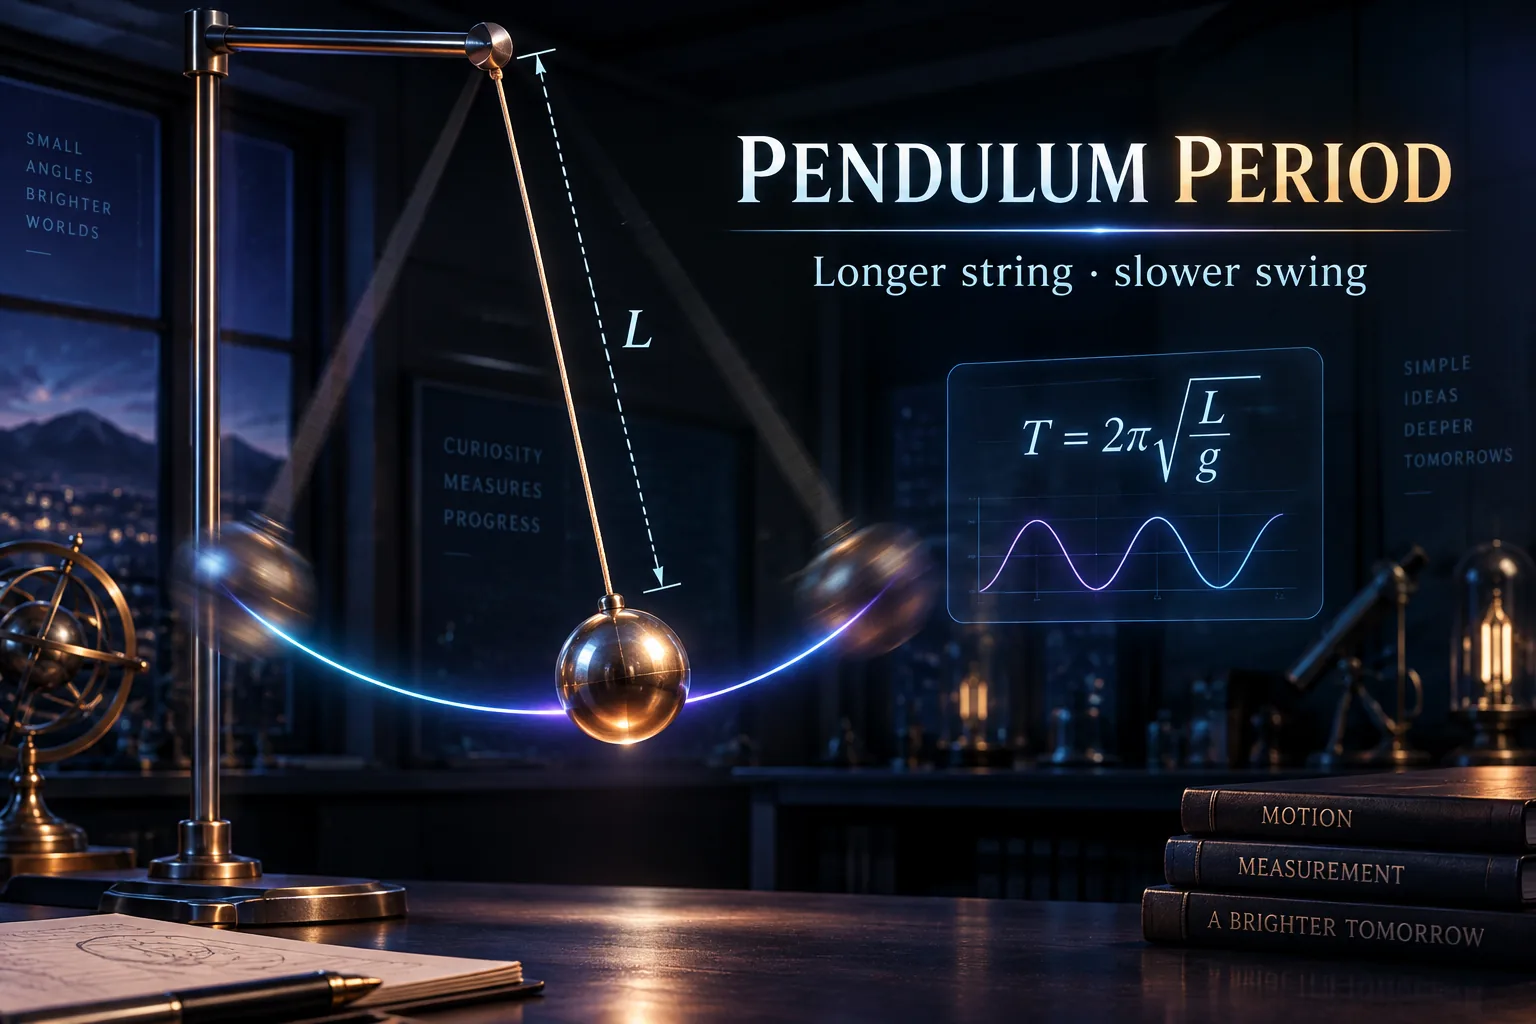
Pendulum period
Change pendulum string length, time ten swings, compare periods, and graph period squared against length to investigate the timing pattern in this experiment.
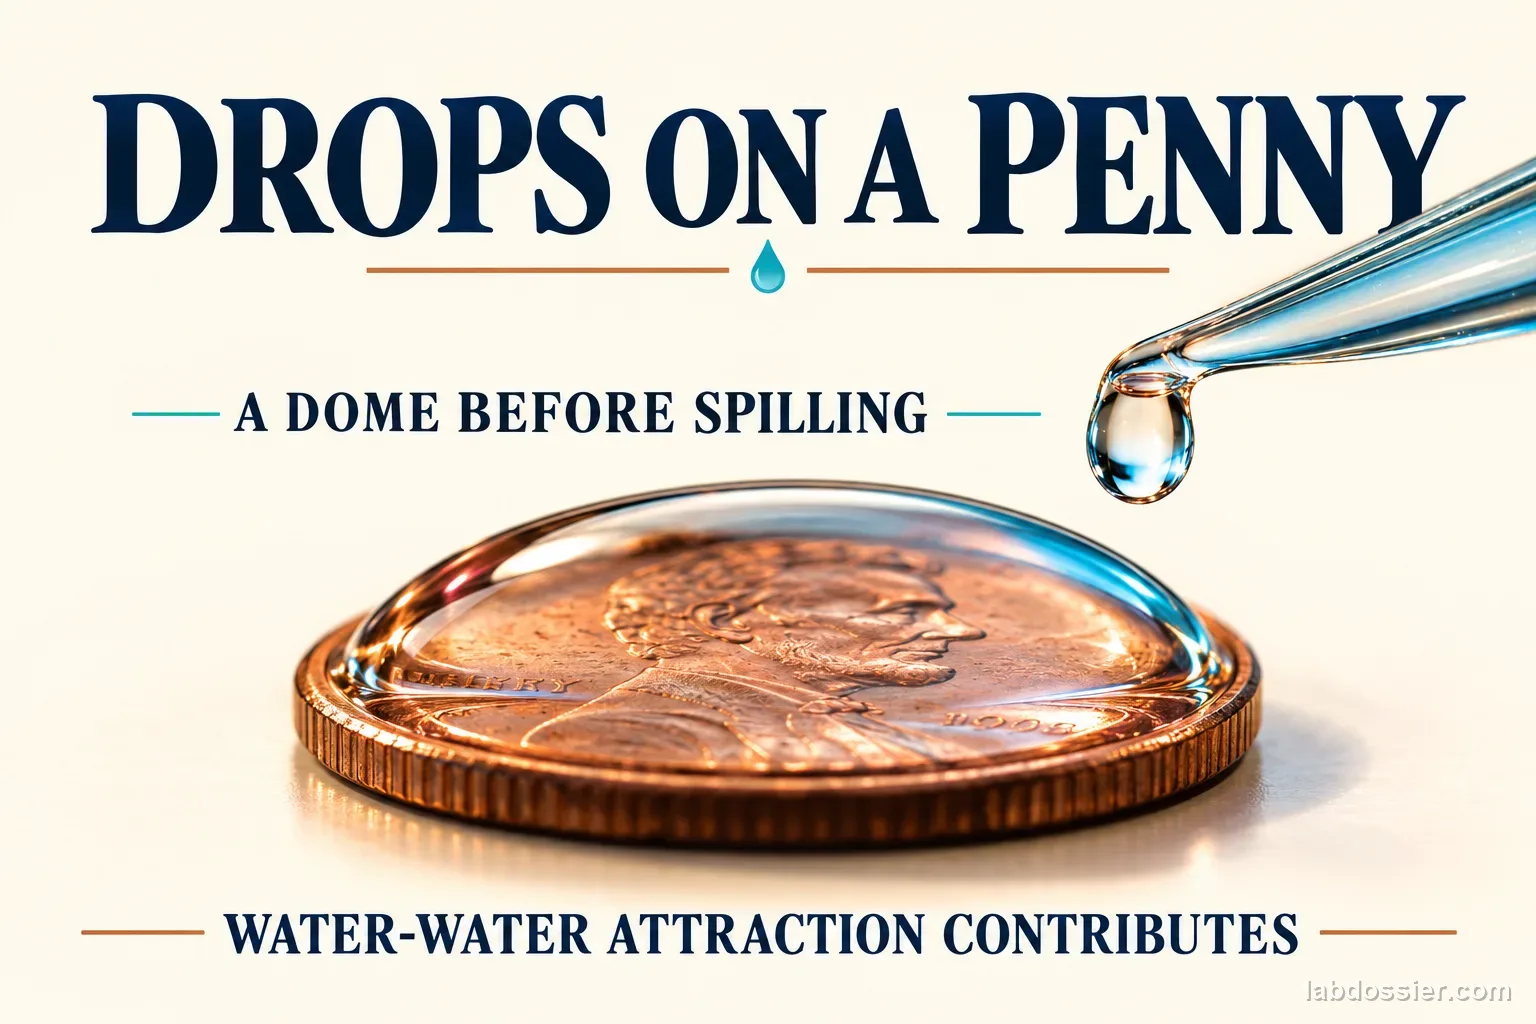
Drops on a penny
Count how many drops of water a penny holds before the dome collapses, then test what soap does to that number.
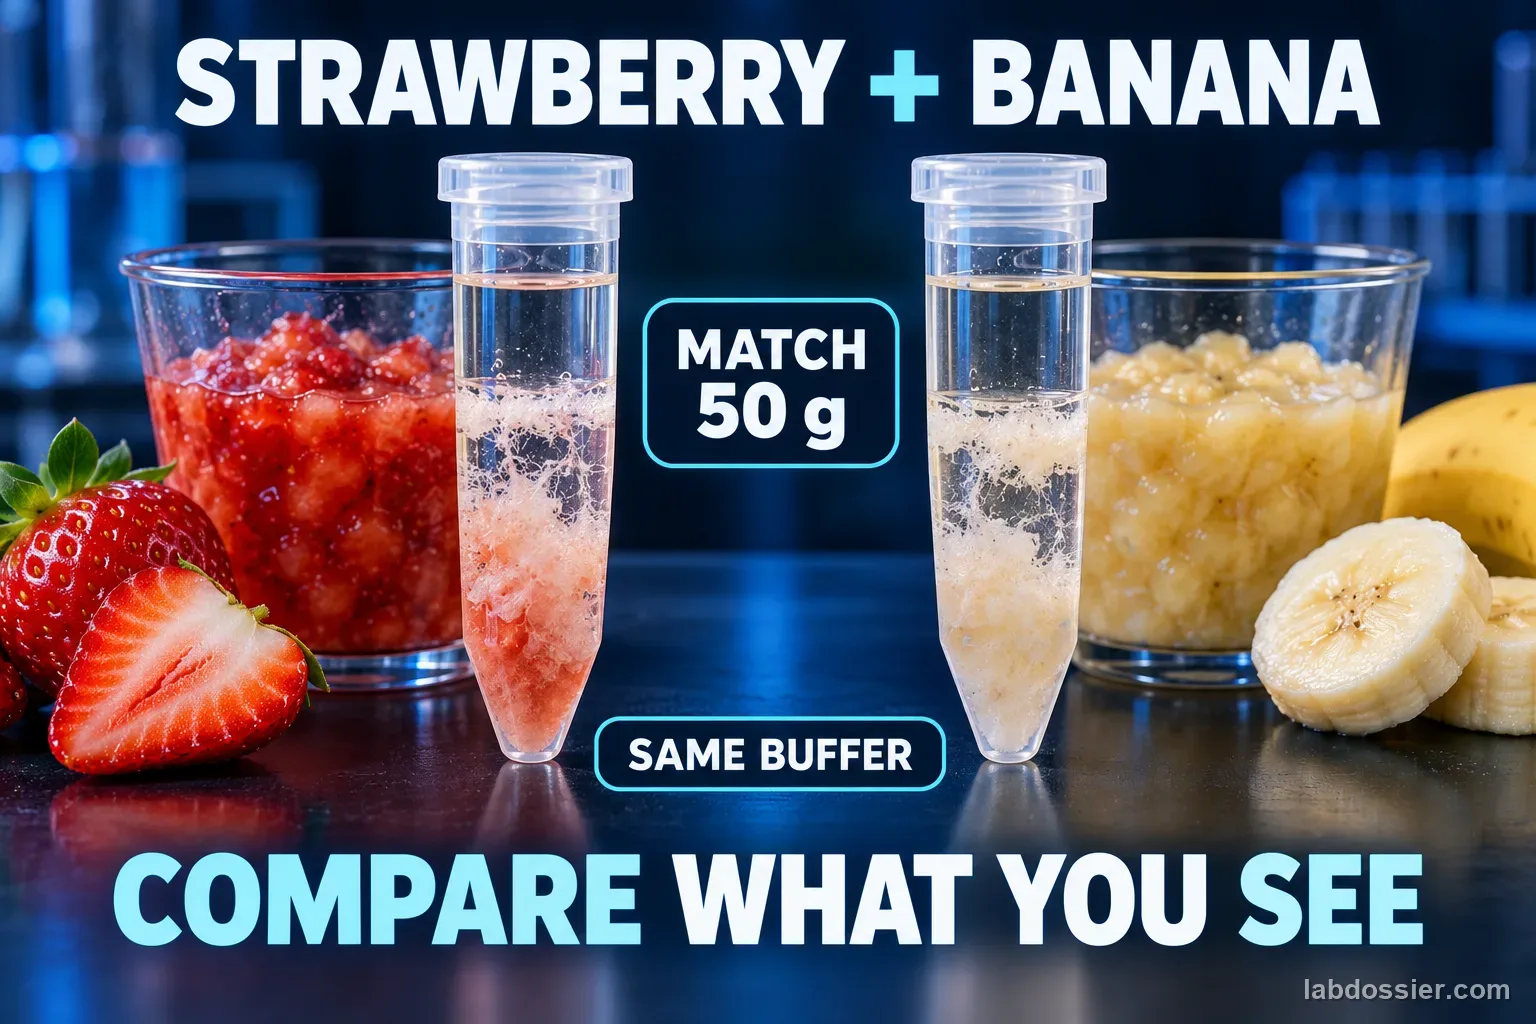
Strawberry DNA
Run three matched extractions each for 50 g strawberry and banana portions, then compare visible precipitate ratings and variation without assuming either fruit wins.
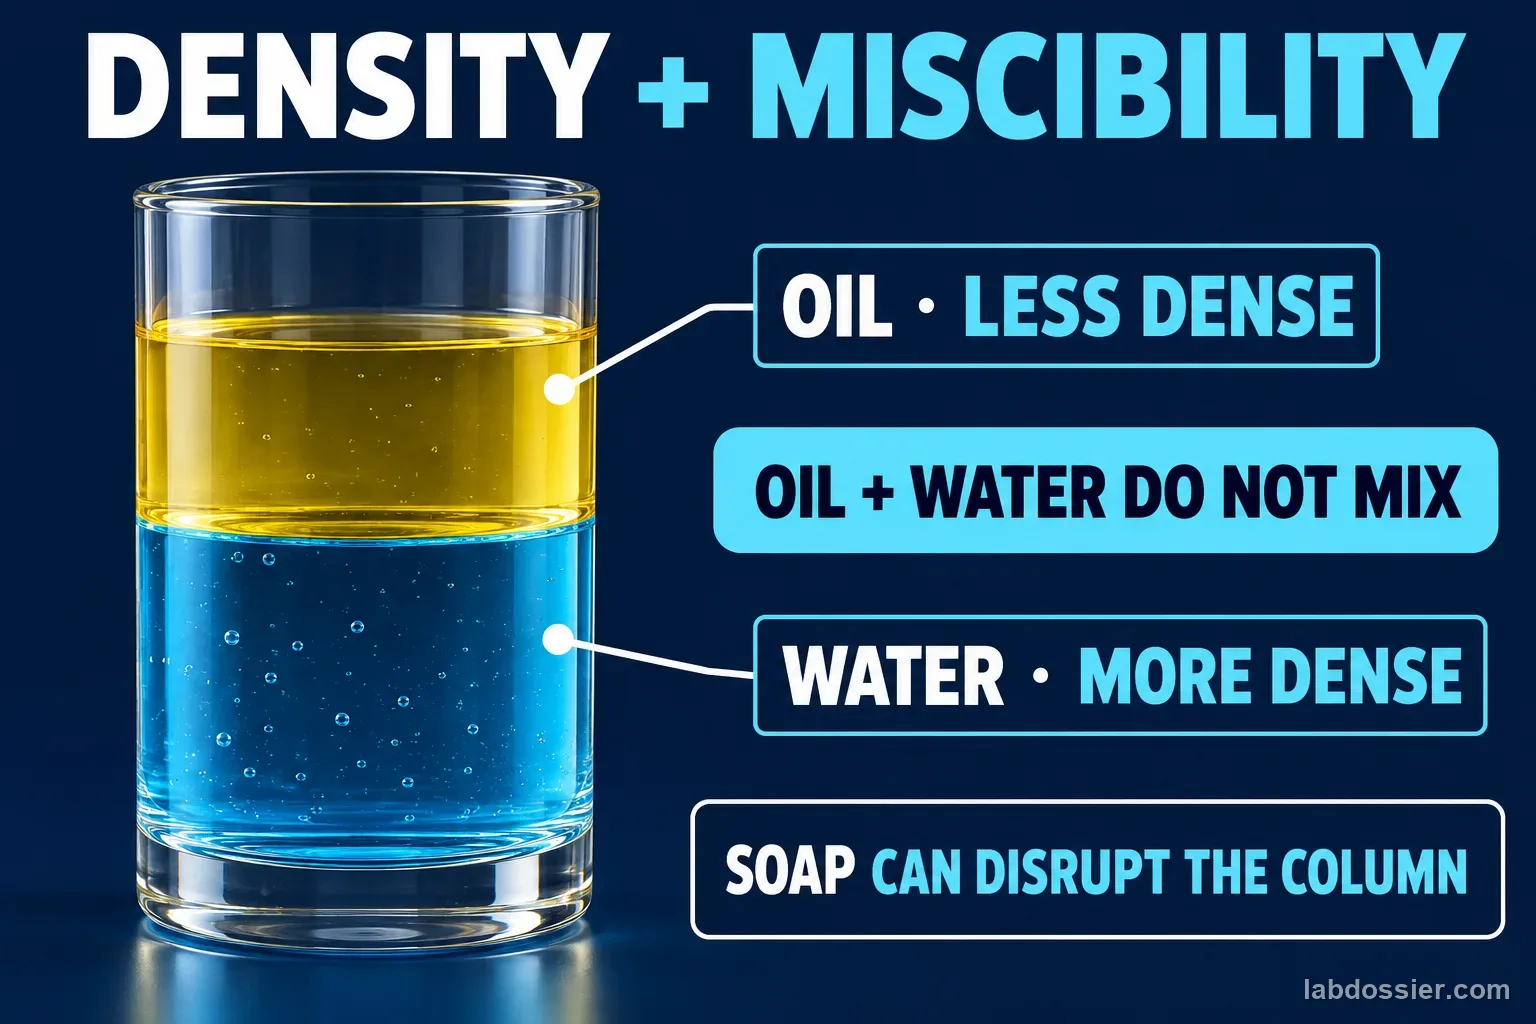
Density column
Measure equal volumes of household liquids by mass, check which liquids stay separate, and observe where dry objects settle in a density column.
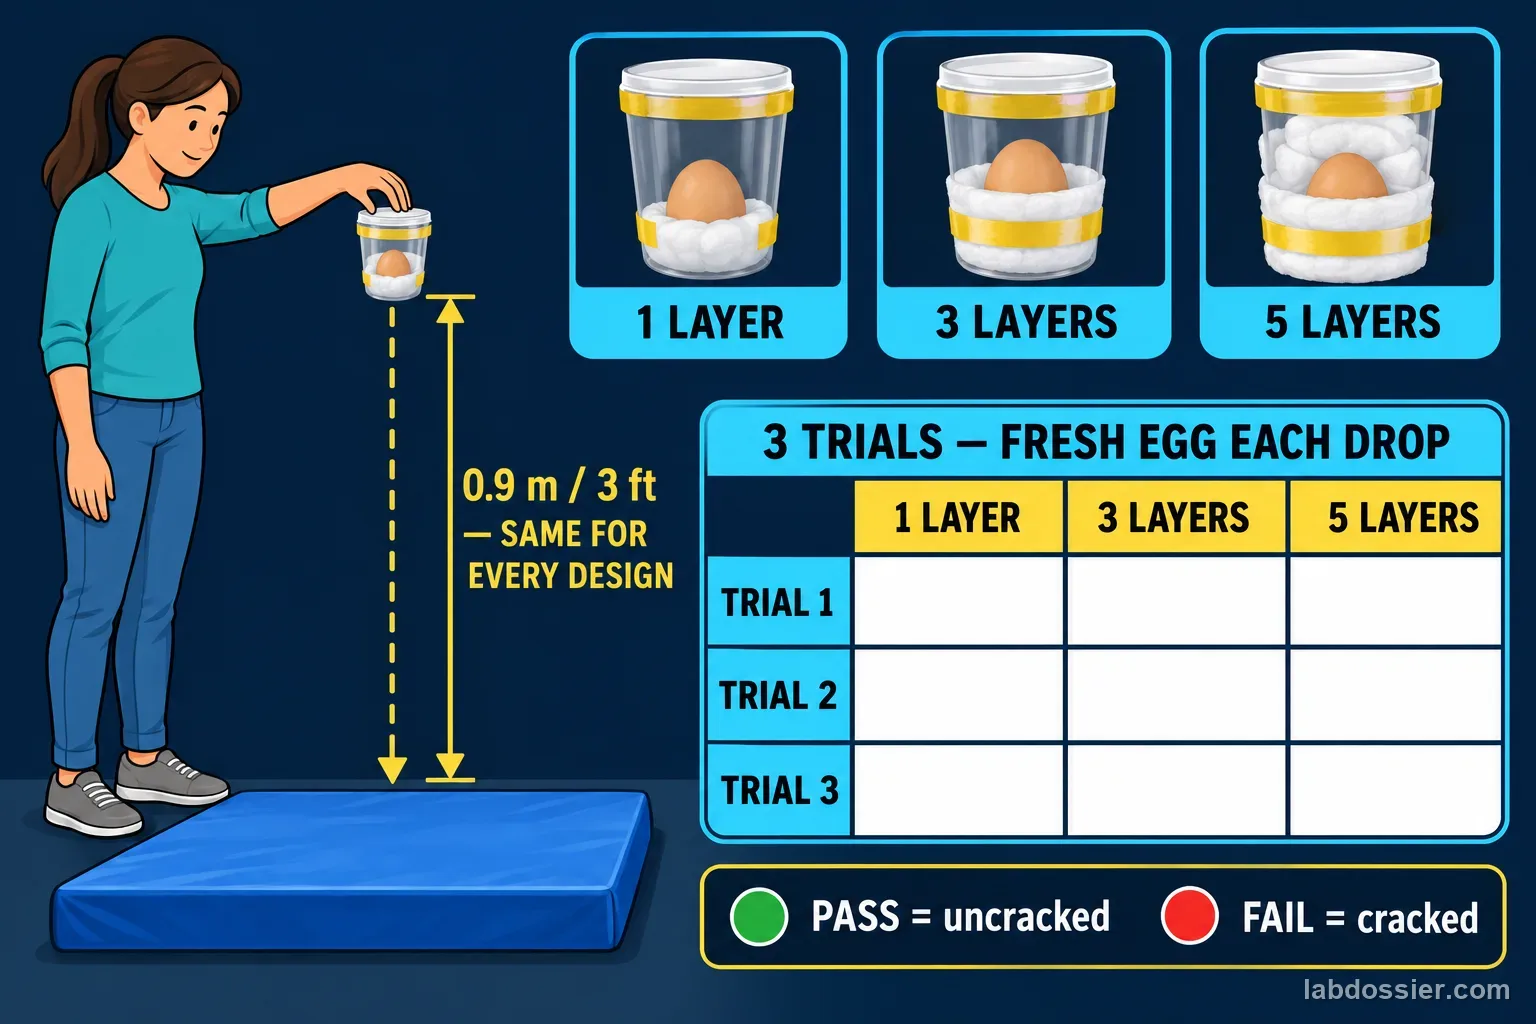
Egg drop challenge
Build matched egg-protection designs with different padding amounts, then compare three fresh-egg trials at one adult-reachable height.
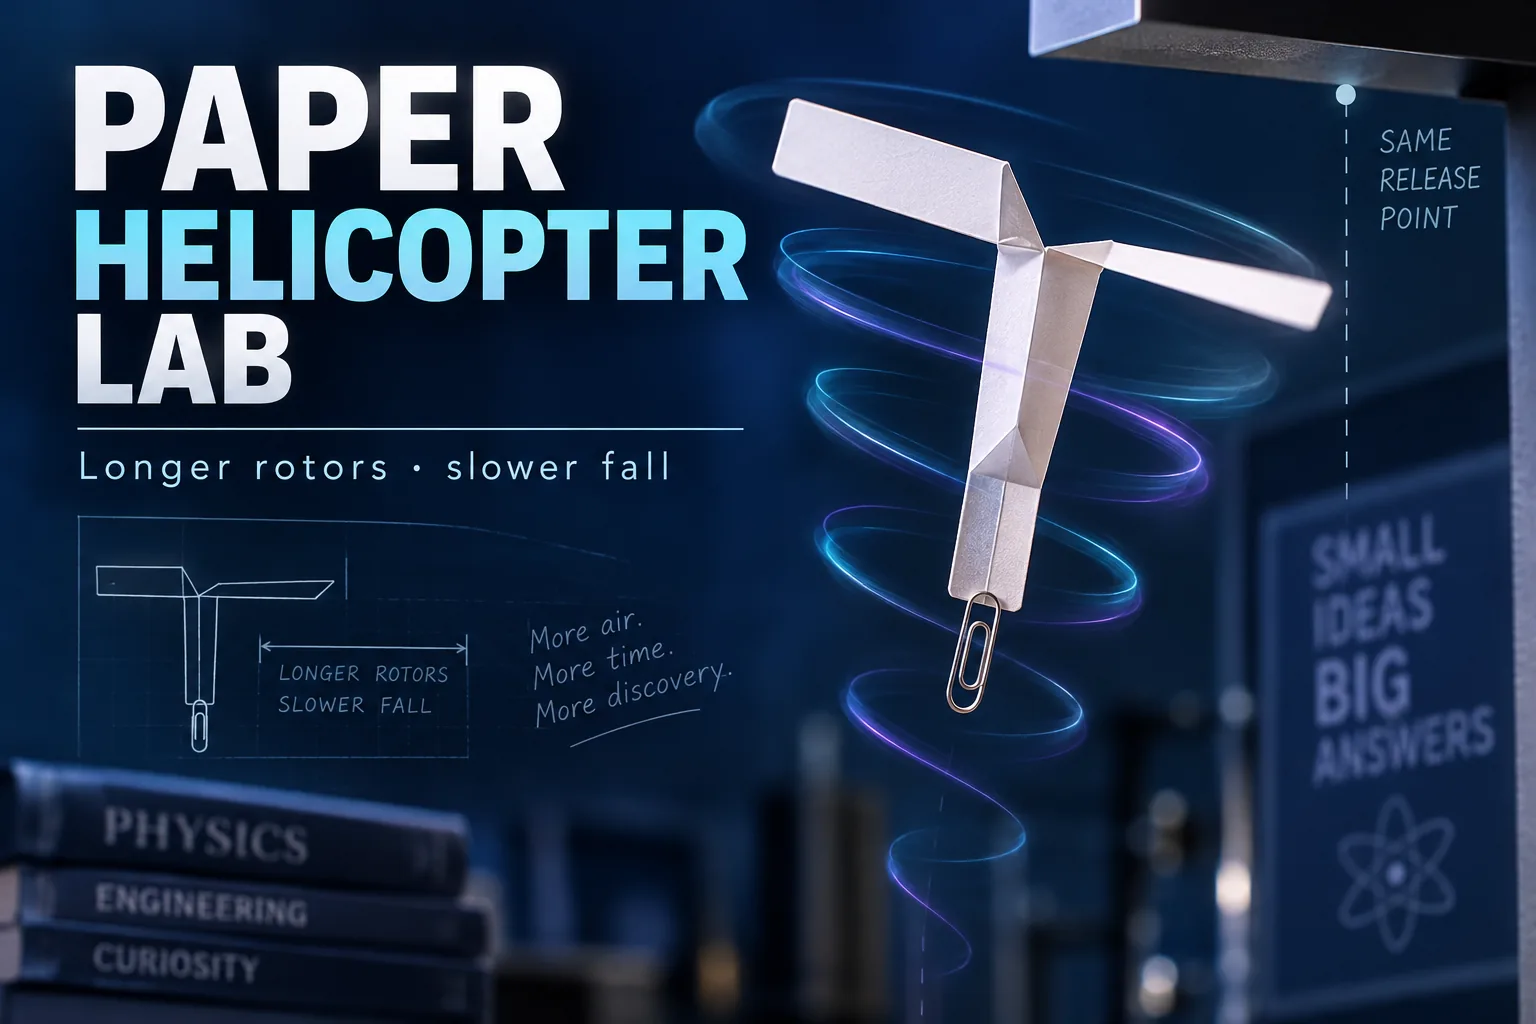
Paper helicopter lab
Compare paper-helicopter rotor lengths at one low height, repeat timed drops, and explain how blade design may affect descent in class tests.
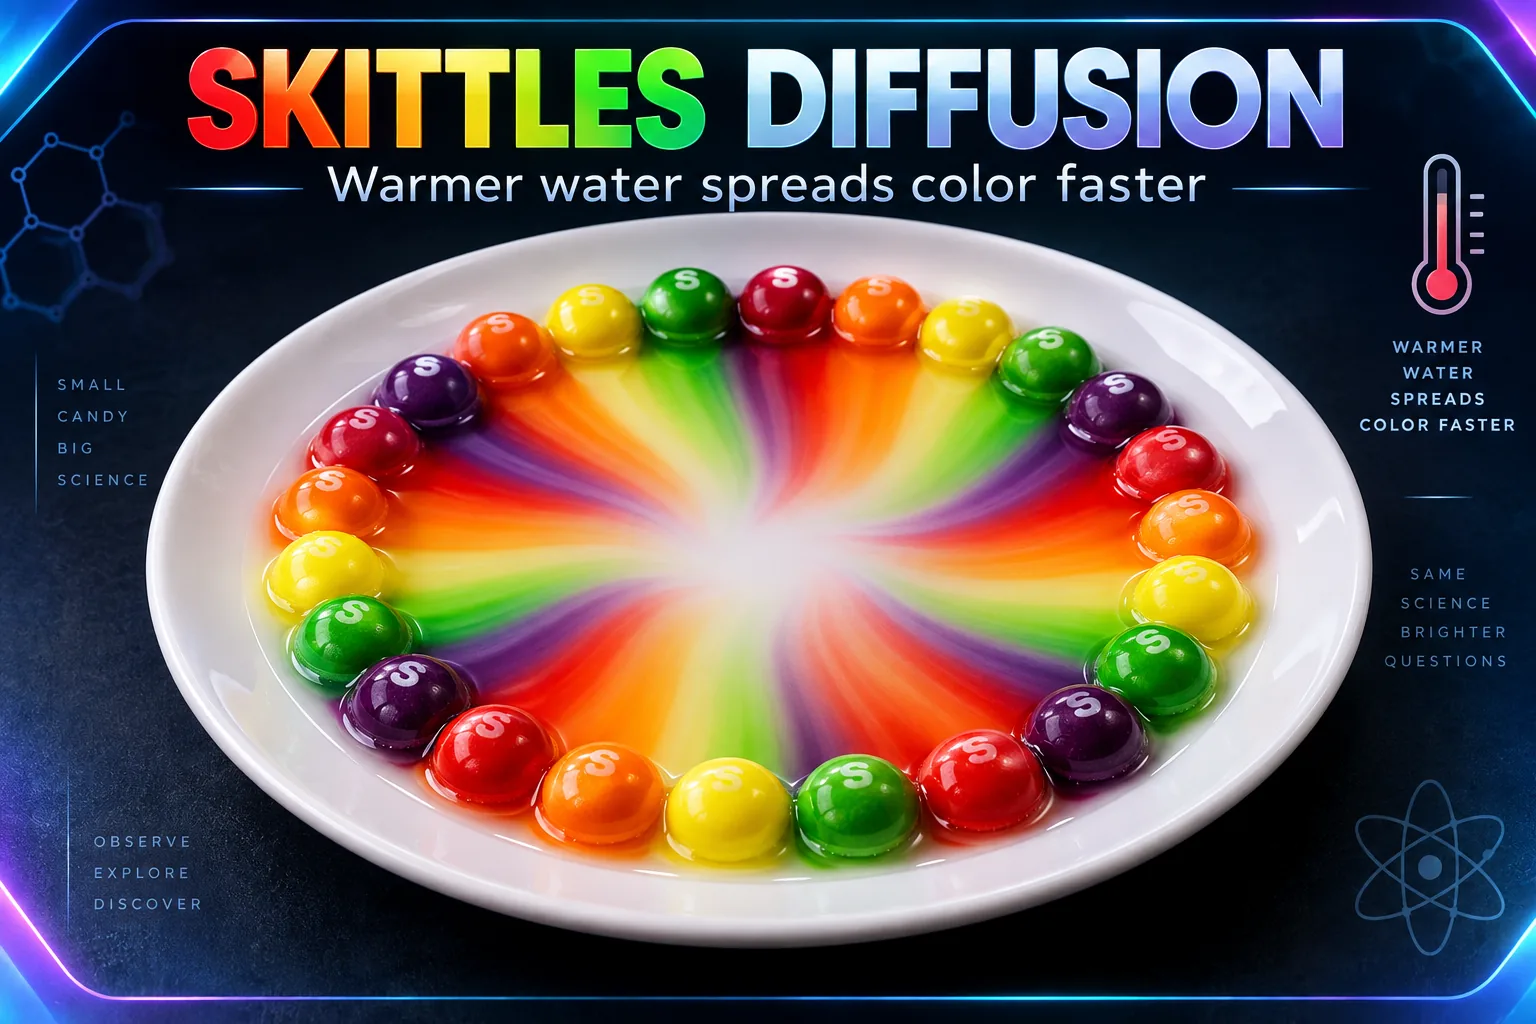
Skittles diffusion experiment
Compare matched candy rings in cold, room-temperature, and comfortably warm water; time when each color front reaches the plate center in class.
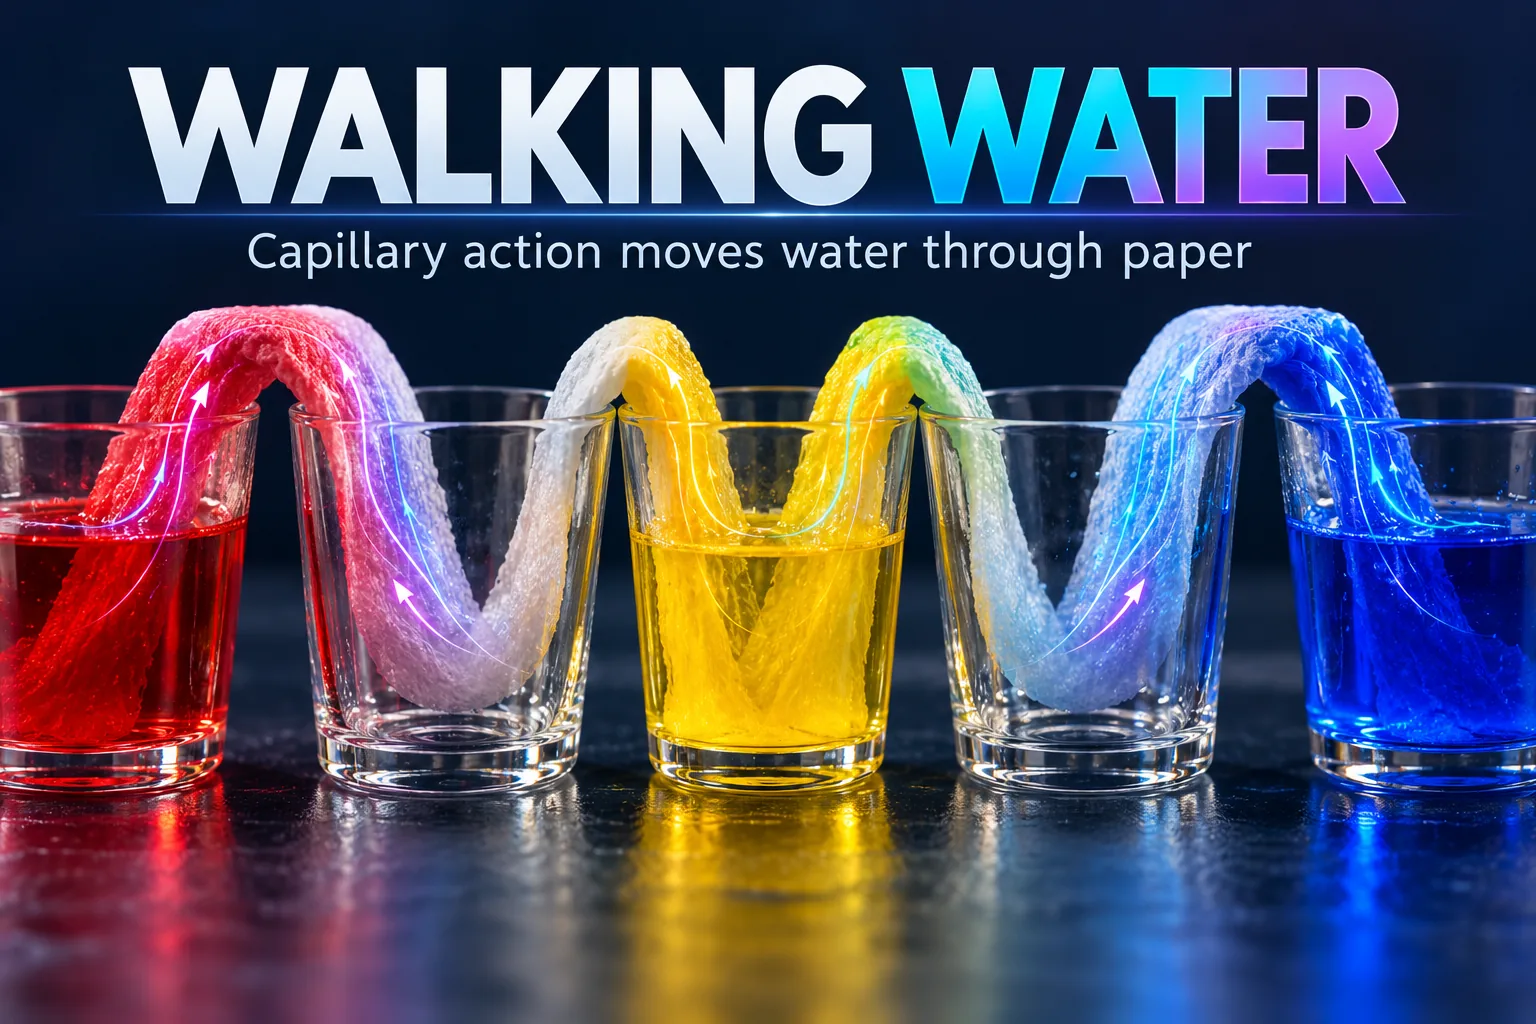
Walking water experiment
Compare three paper-towel types with matched bridges, measure water travel distance, and observe capillary action as water moves between cups.
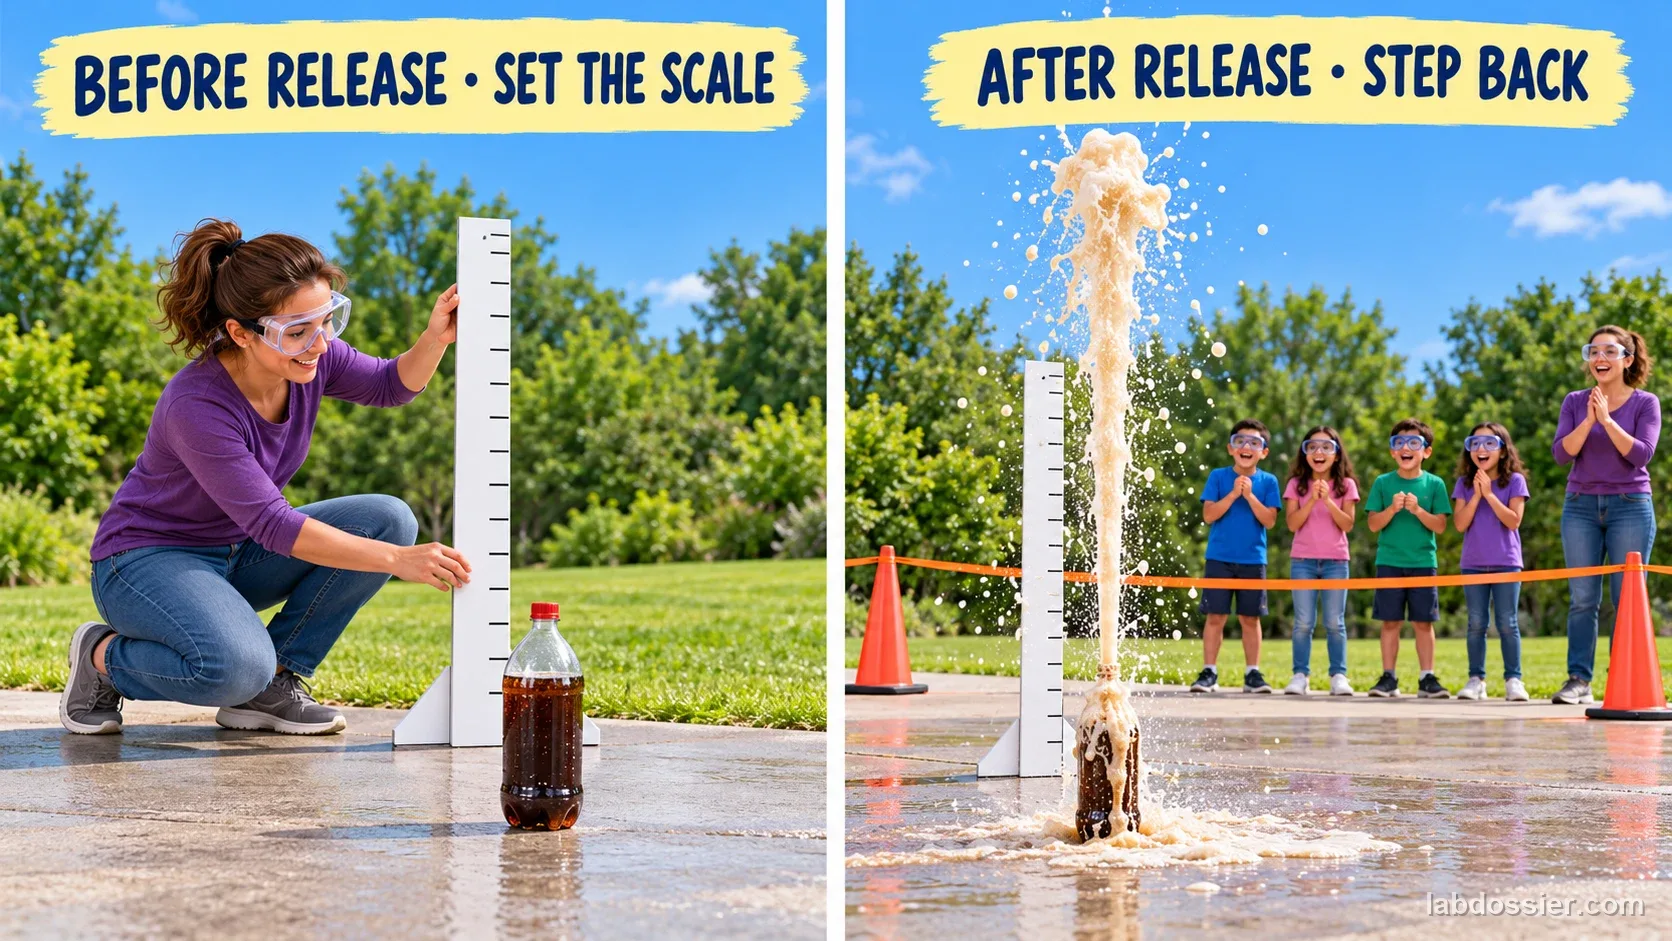
Mentos and soda geyser
Test how Mentos change a soda geyser, measure the plume safely, and learn why dissolved carbon dioxide escapes without a new reaction outdoors.
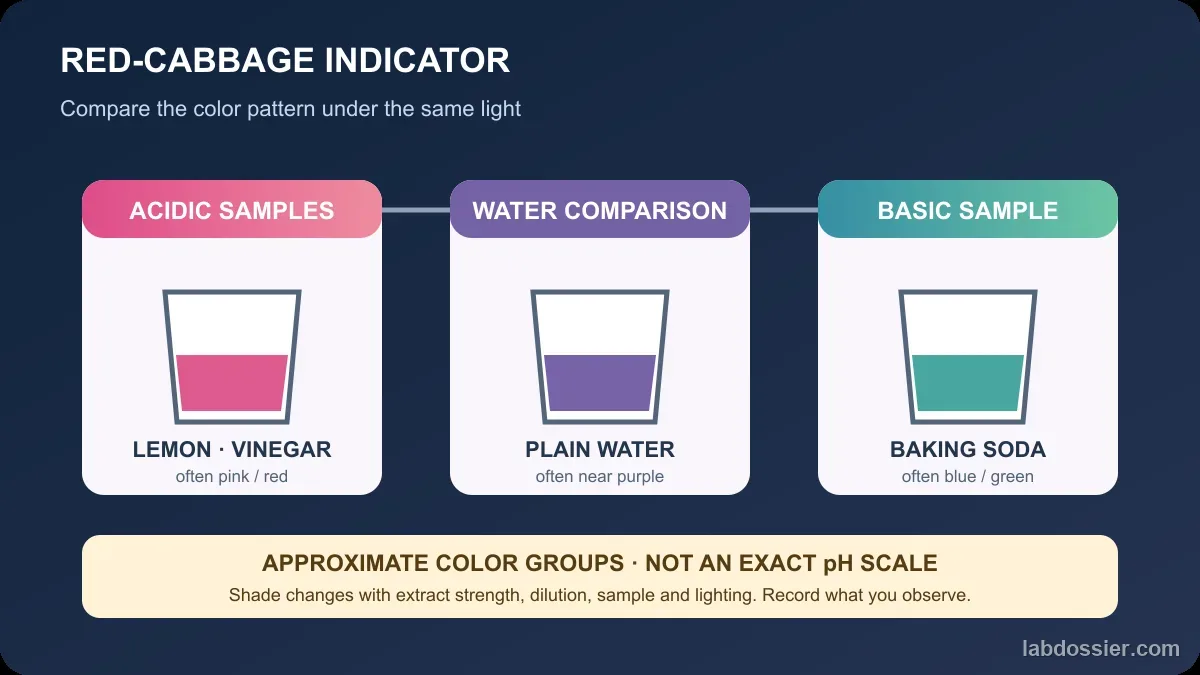
Red cabbage pH indicator lab
Test lemon juice, vinegar, water, and baking-soda solution with cooled red-cabbage indicator; compare colors and treat pH estimates as approximate.
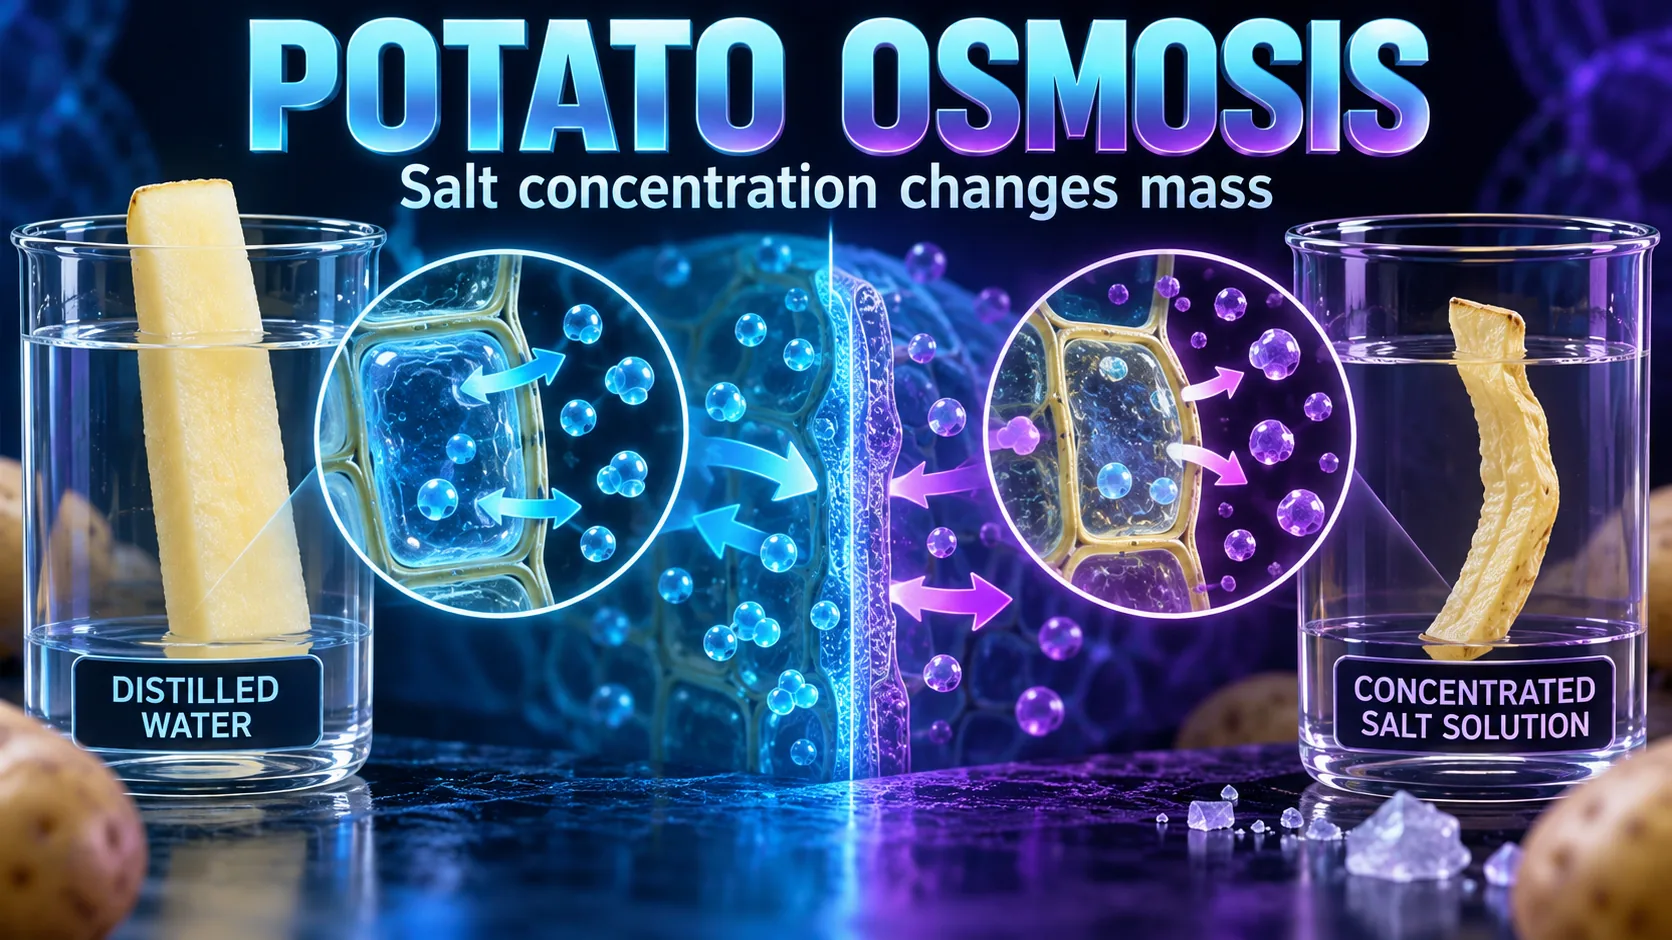
Potato osmosis lab
Soak matched potato strips for 24 hours in three salt concentrations, then compare replicate mass changes to investigate osmosis in plant tissue.
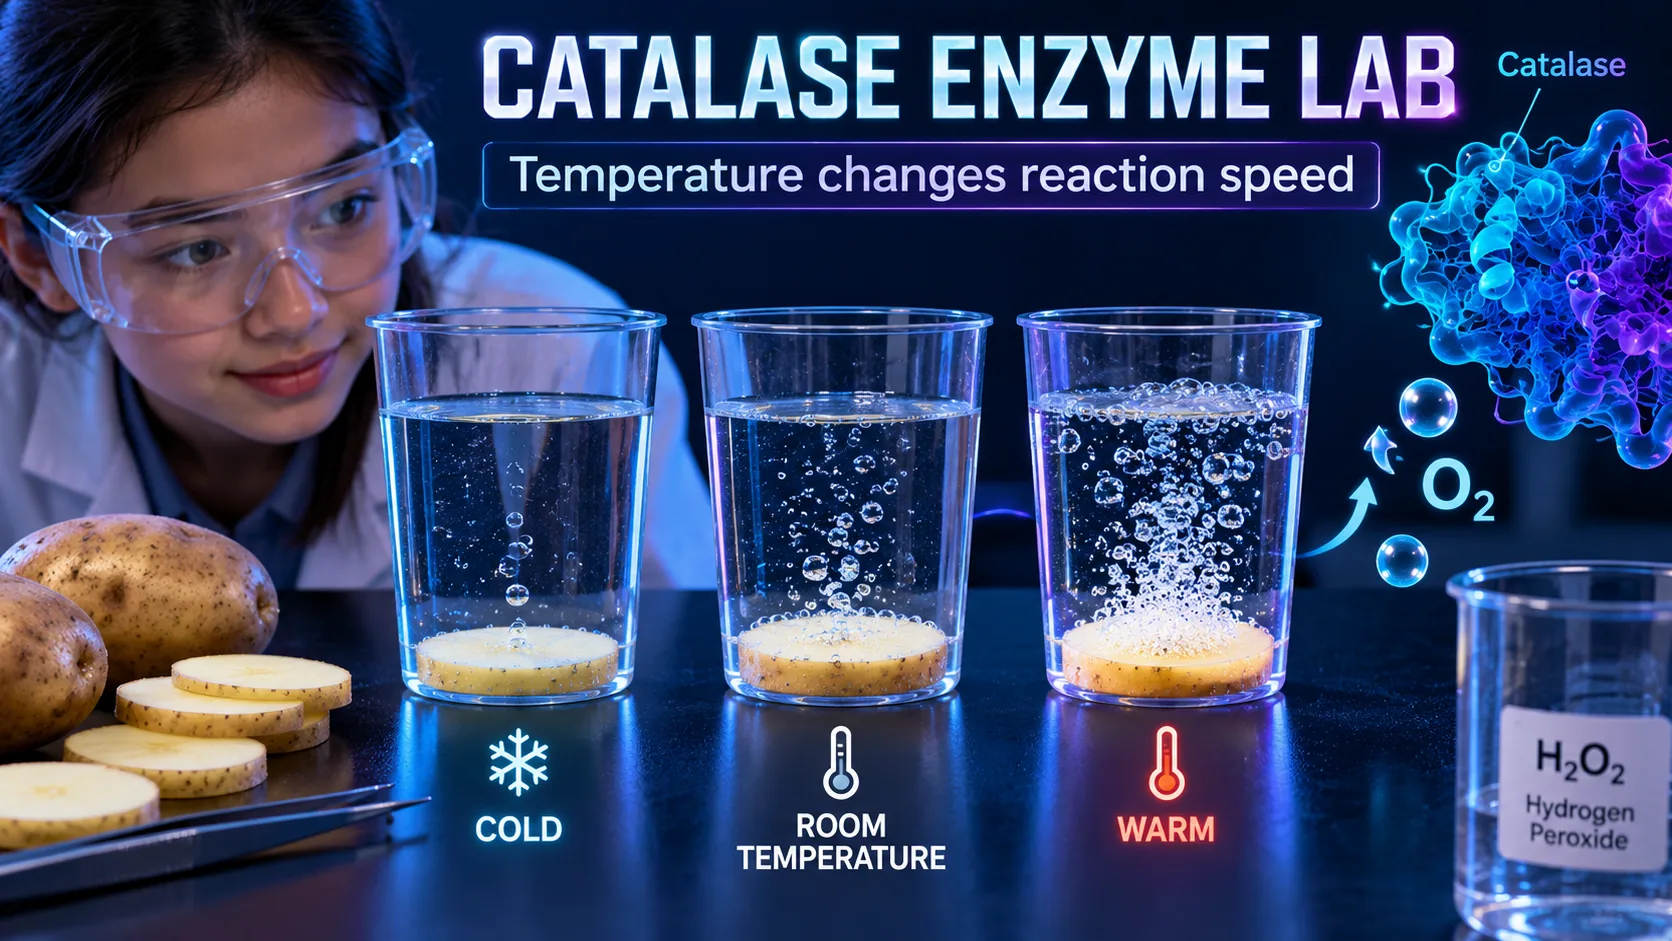
Catalase enzyme lab
Compare cold, room-temperature and comfortably warm potato-catalase reactions using three fresh trials per condition.
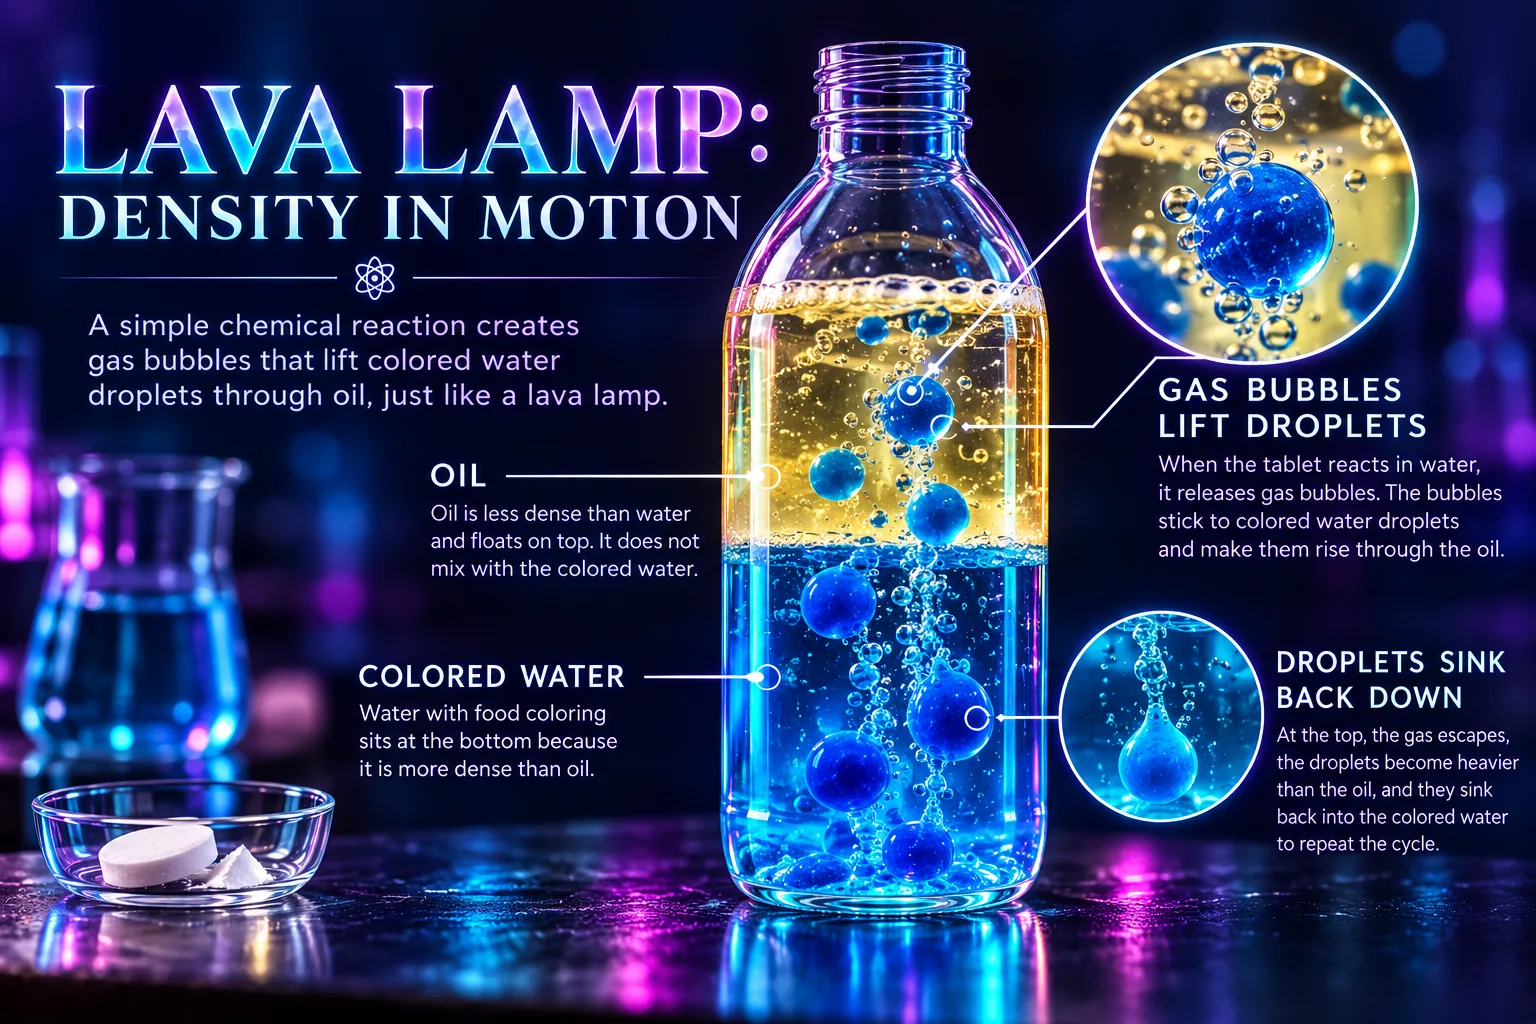
Homemade lava lamp lab
Build matched oil-and-colored-water bottles, compare three tablet amounts with repeated trials, and time one clearly defined bubbling endpoint.
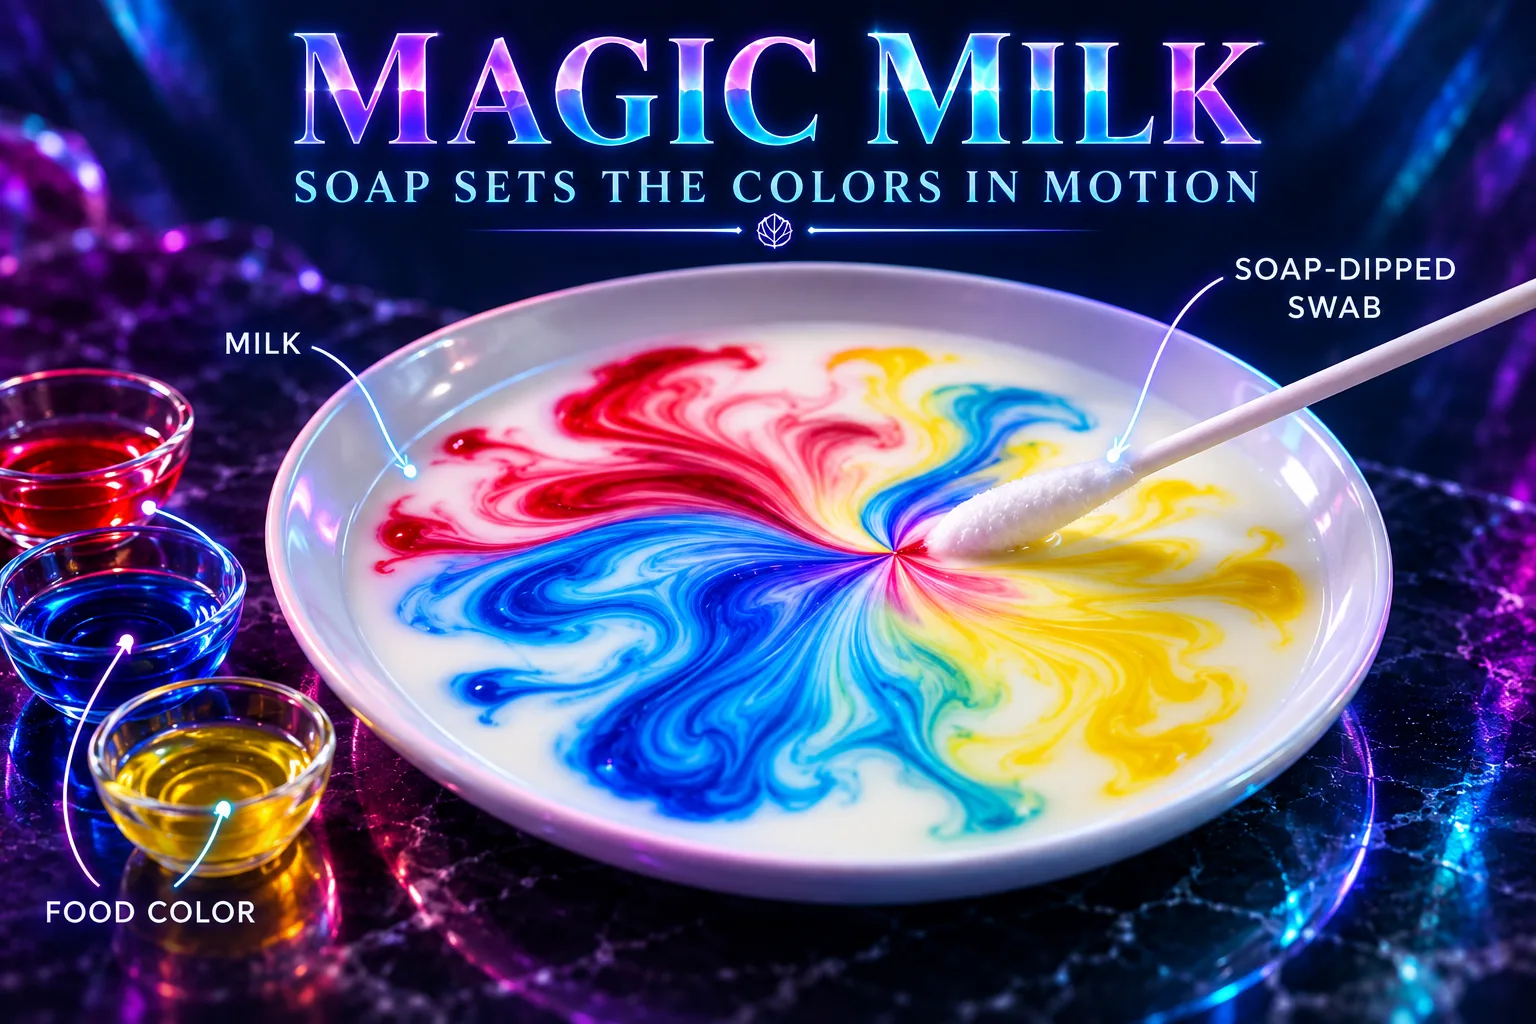
Magic milk experiment
Compare whole, 2% and skim milk in matched soap trials; time visible color motion and investigate how soap changes surface tension in a controlled test.
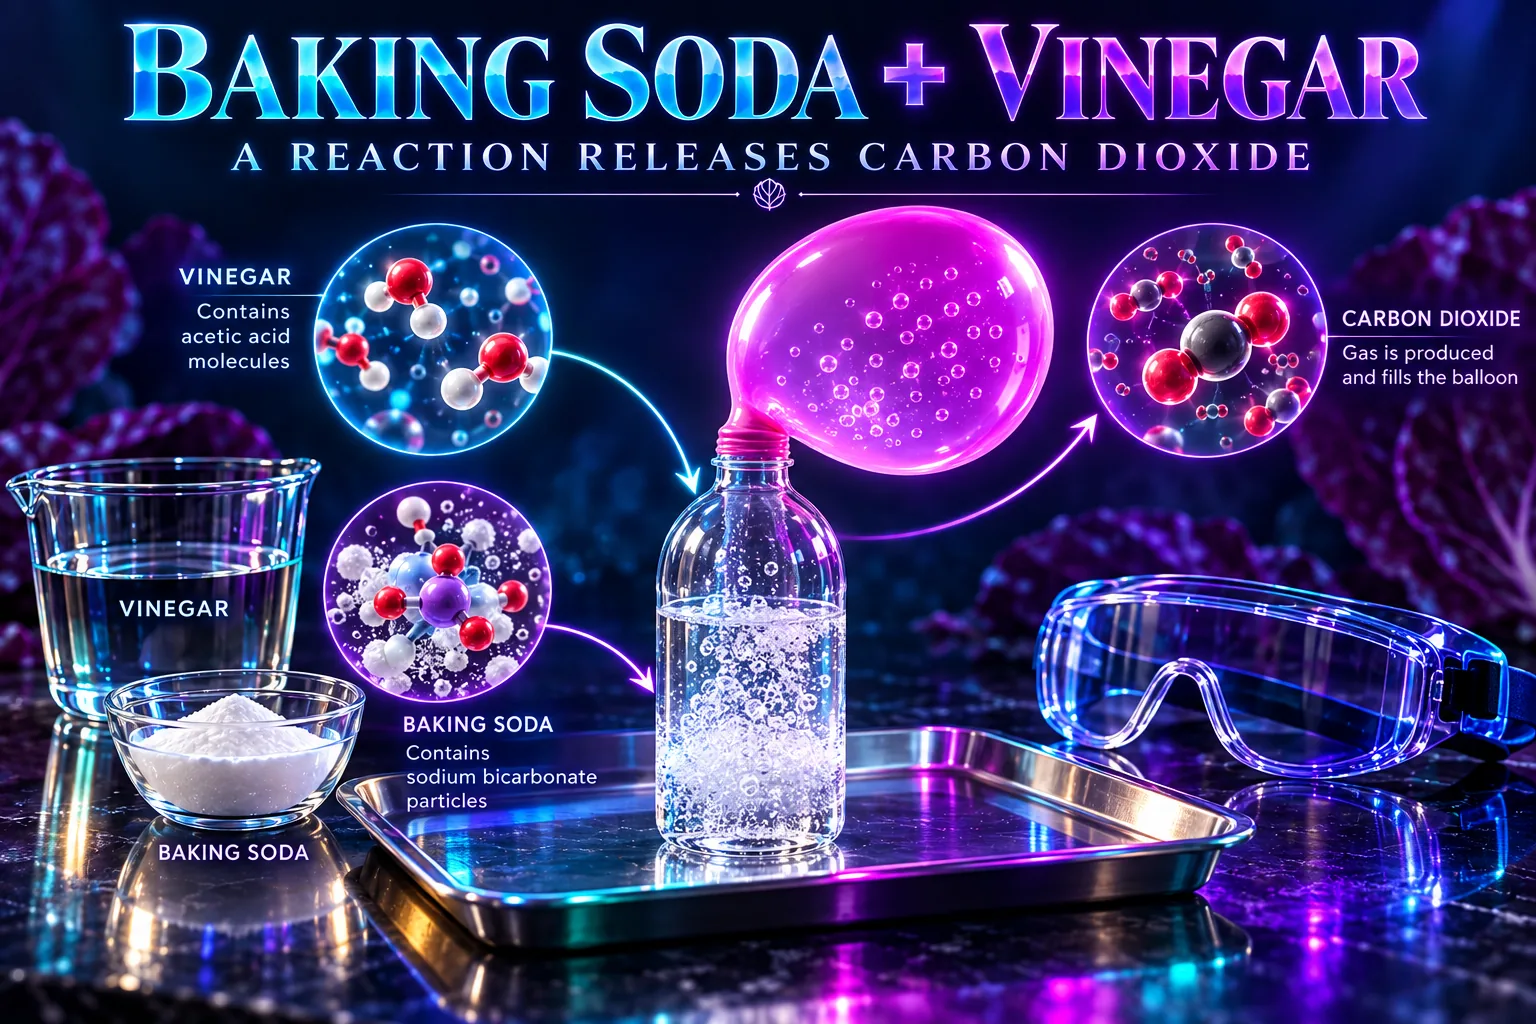
Baking soda and vinegar reaction lab
Compare measured baking-soda amounts with the same vinegar volume, then record balloon circumference to investigate the carbon dioxide reaction.
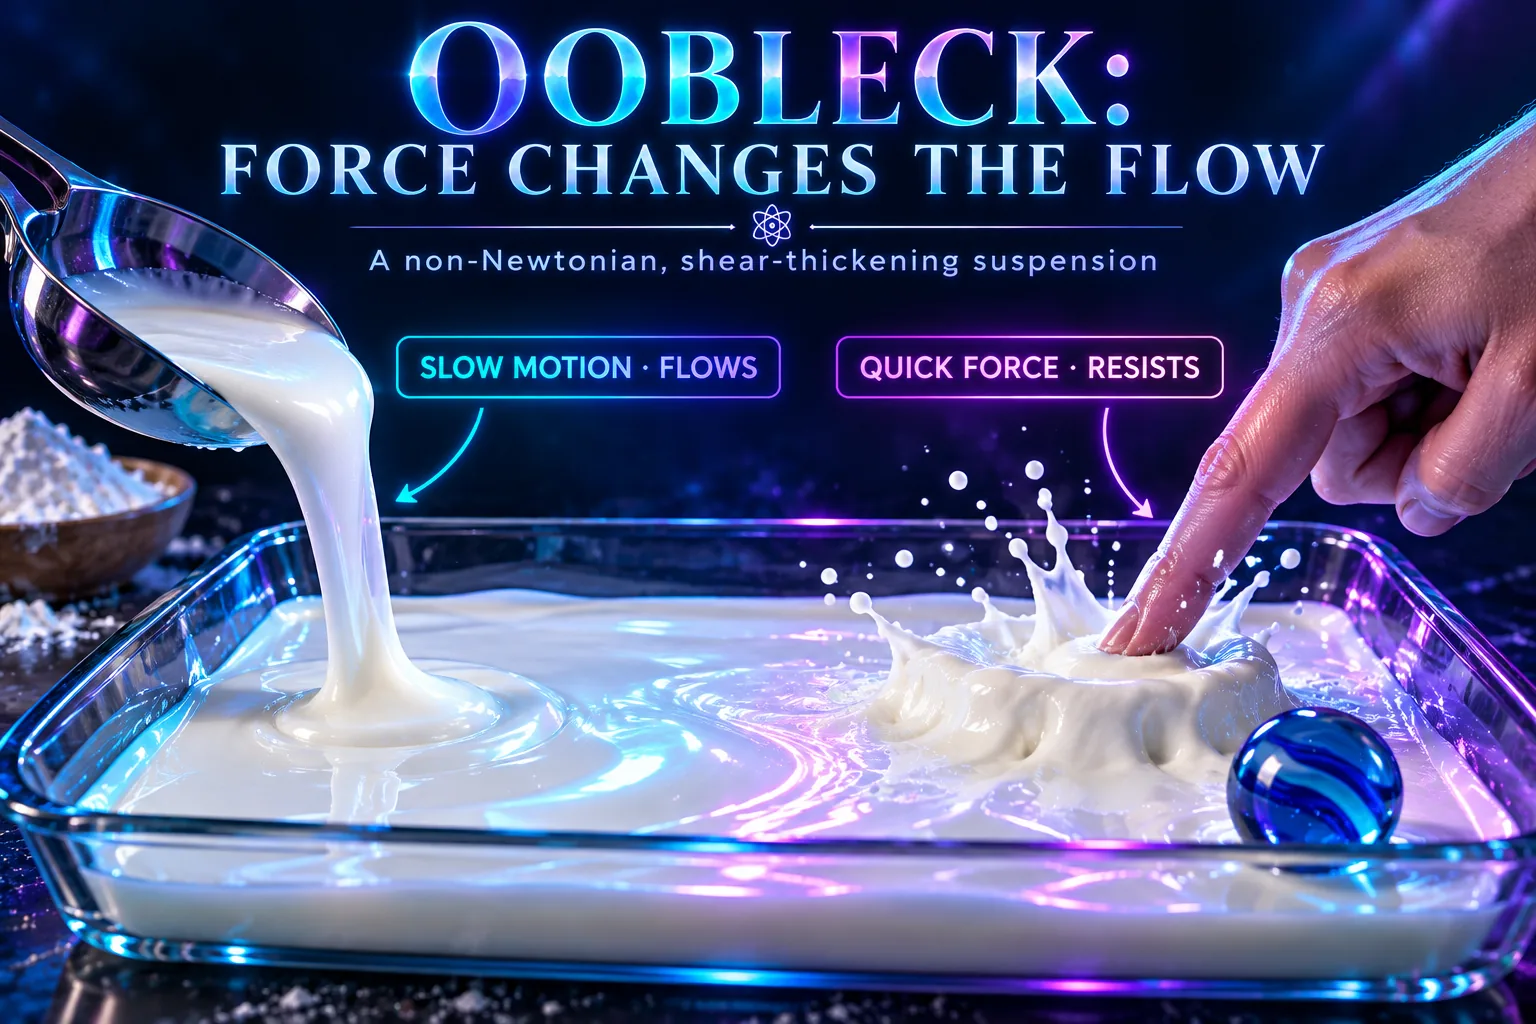
Oobleck non-Newtonian fluid lab
Compare three cornstarch-to-water ratios with repeated five-second marble-depth readings and a separate quick-tap observation.
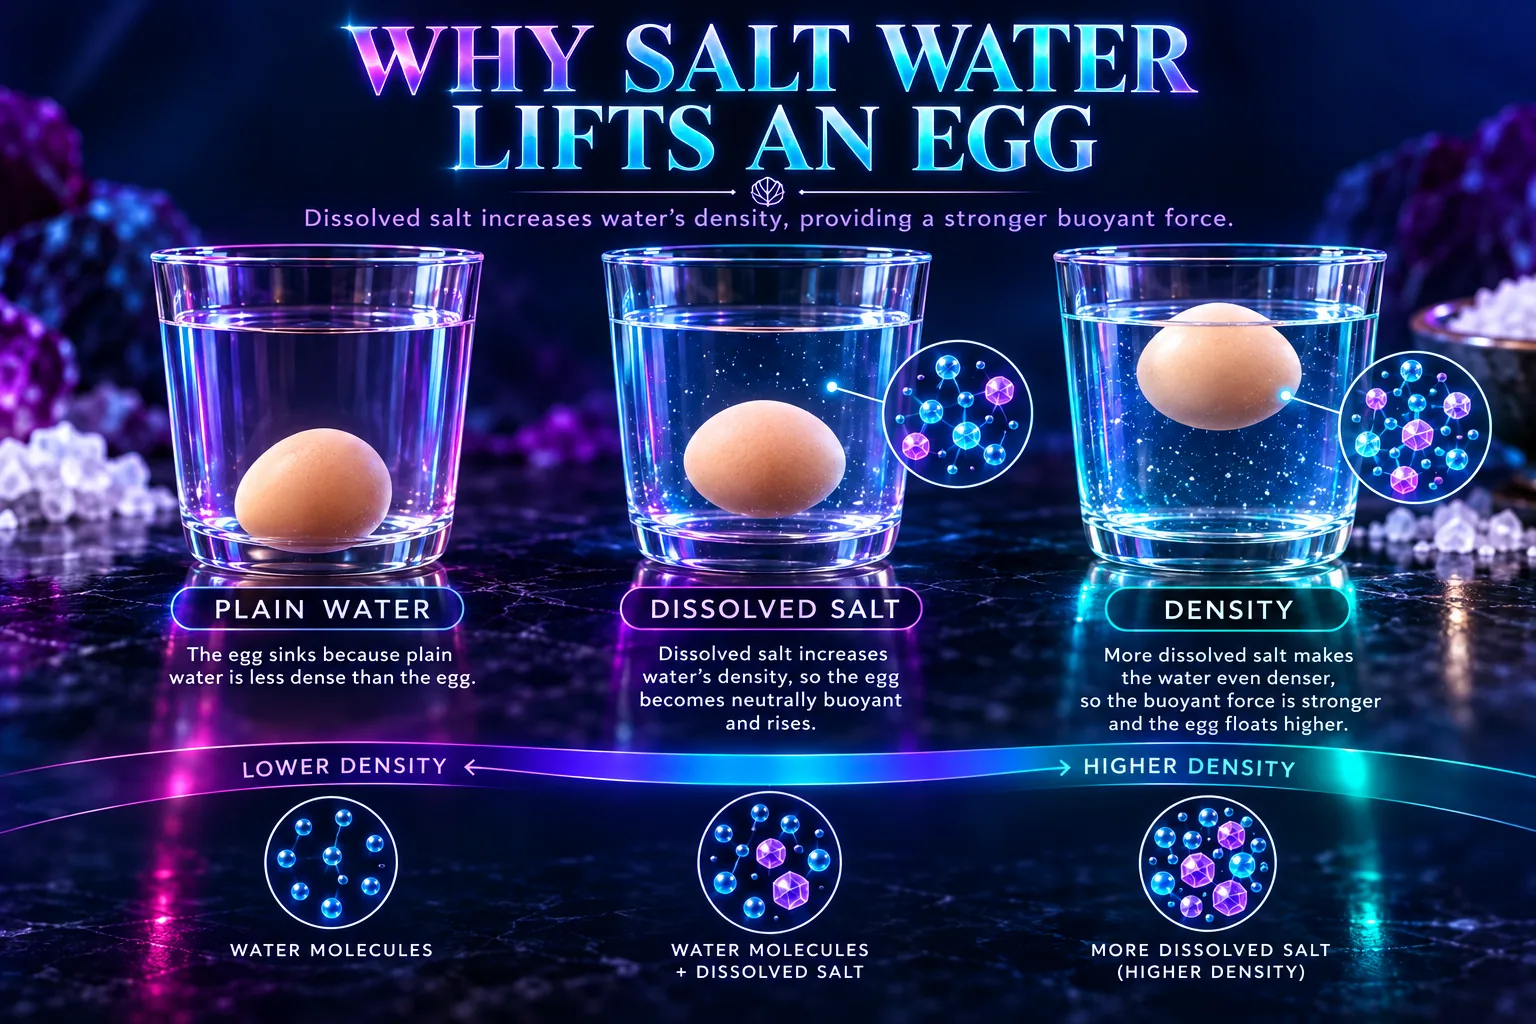
Salt water egg float lab
Dissolve different amounts of salt into water and lower an egg into each cup to find how much salt it takes to make the egg float.
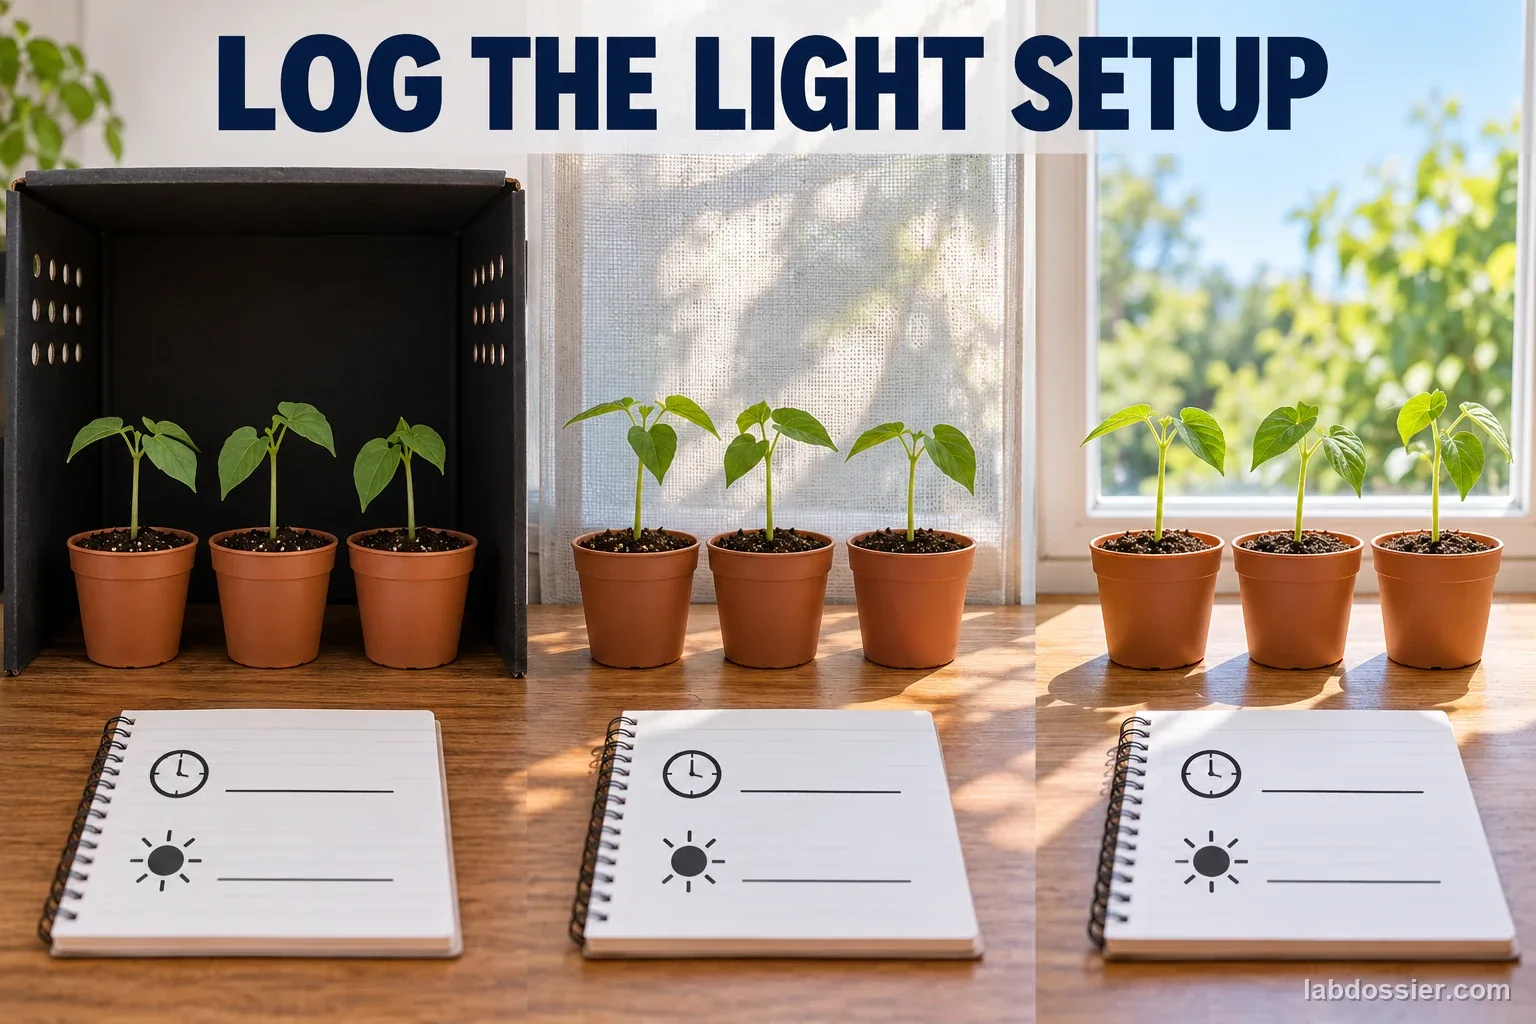
Plant growth and light lab
Compare seedlings under different light conditions, record growth over two weeks, and consider why height alone may not show plant health in this test.
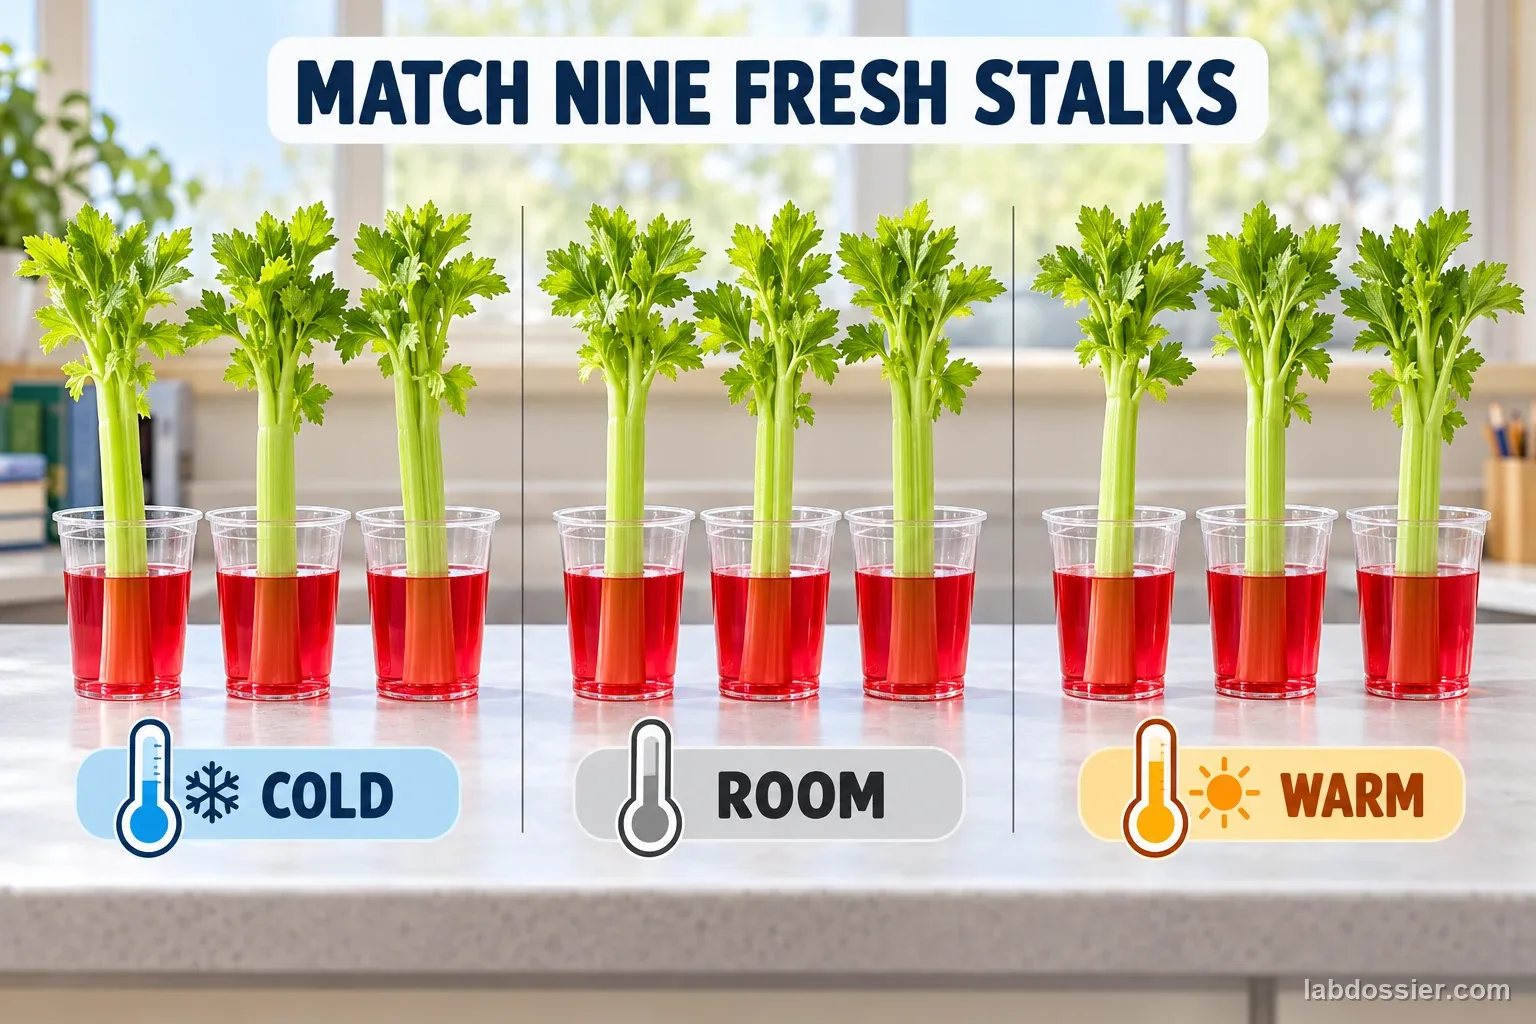
Celery and food coloring lab
Compare celery stalks in three measured water temperatures; log temperature drift, leaf-color arrival, and dye height after 24 hours in this lab.
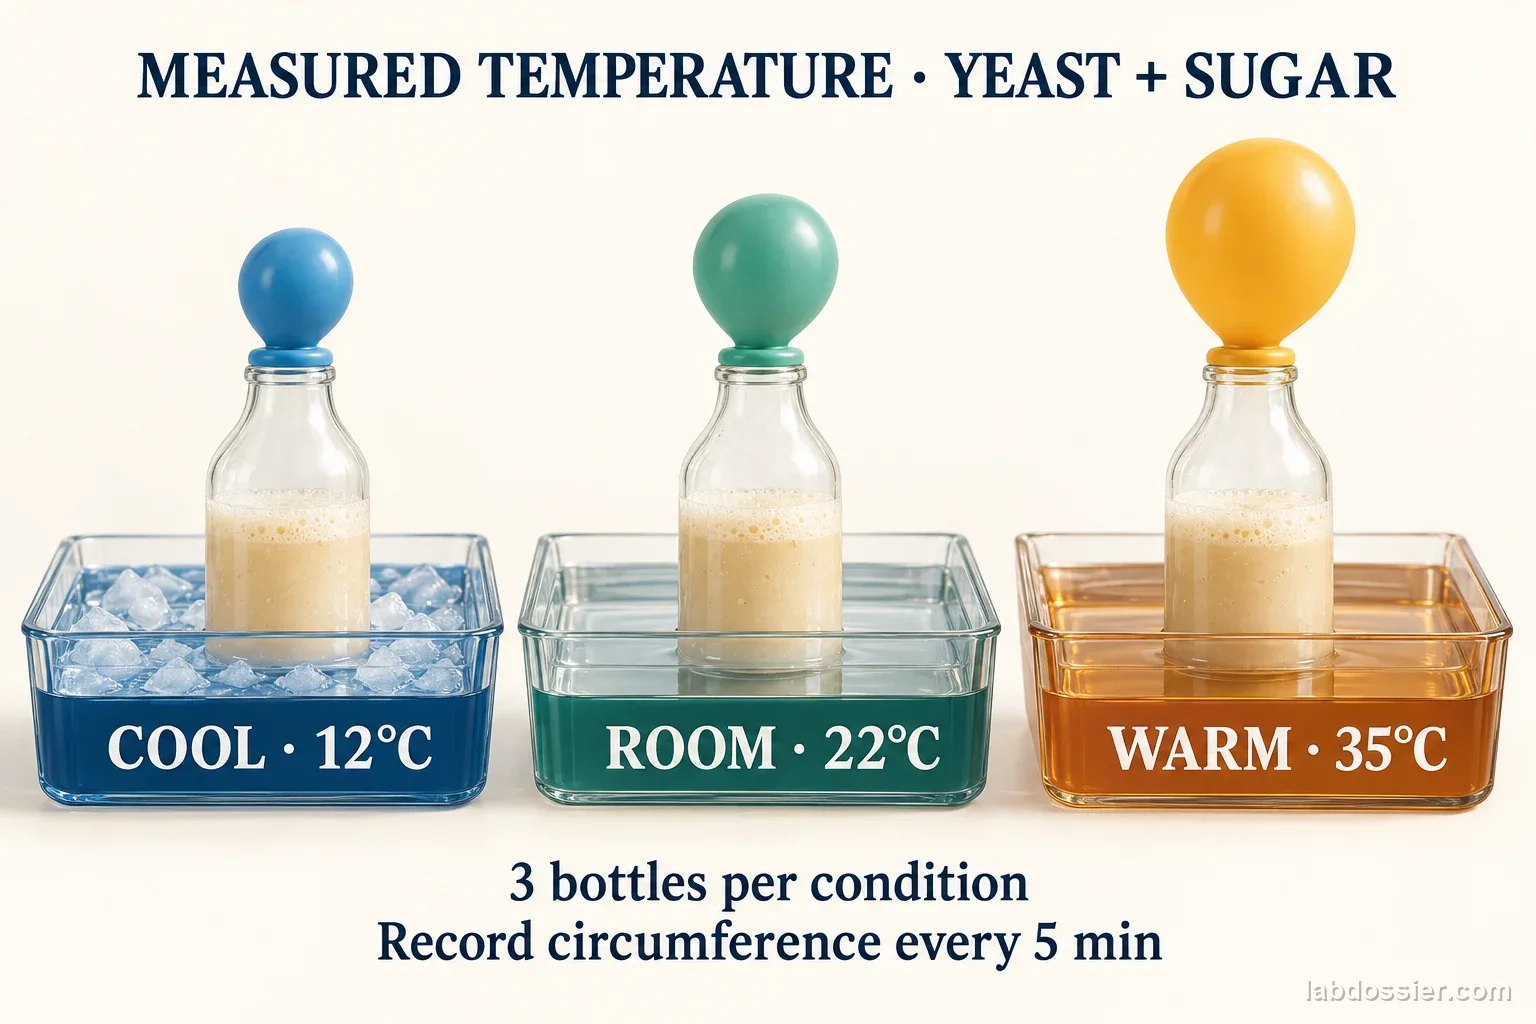
Yeast balloon experiment
Compare matched yeast-and-sugar bottles at three starting water temperatures; measure balloon circumference at five times over 20 minutes in this lab.
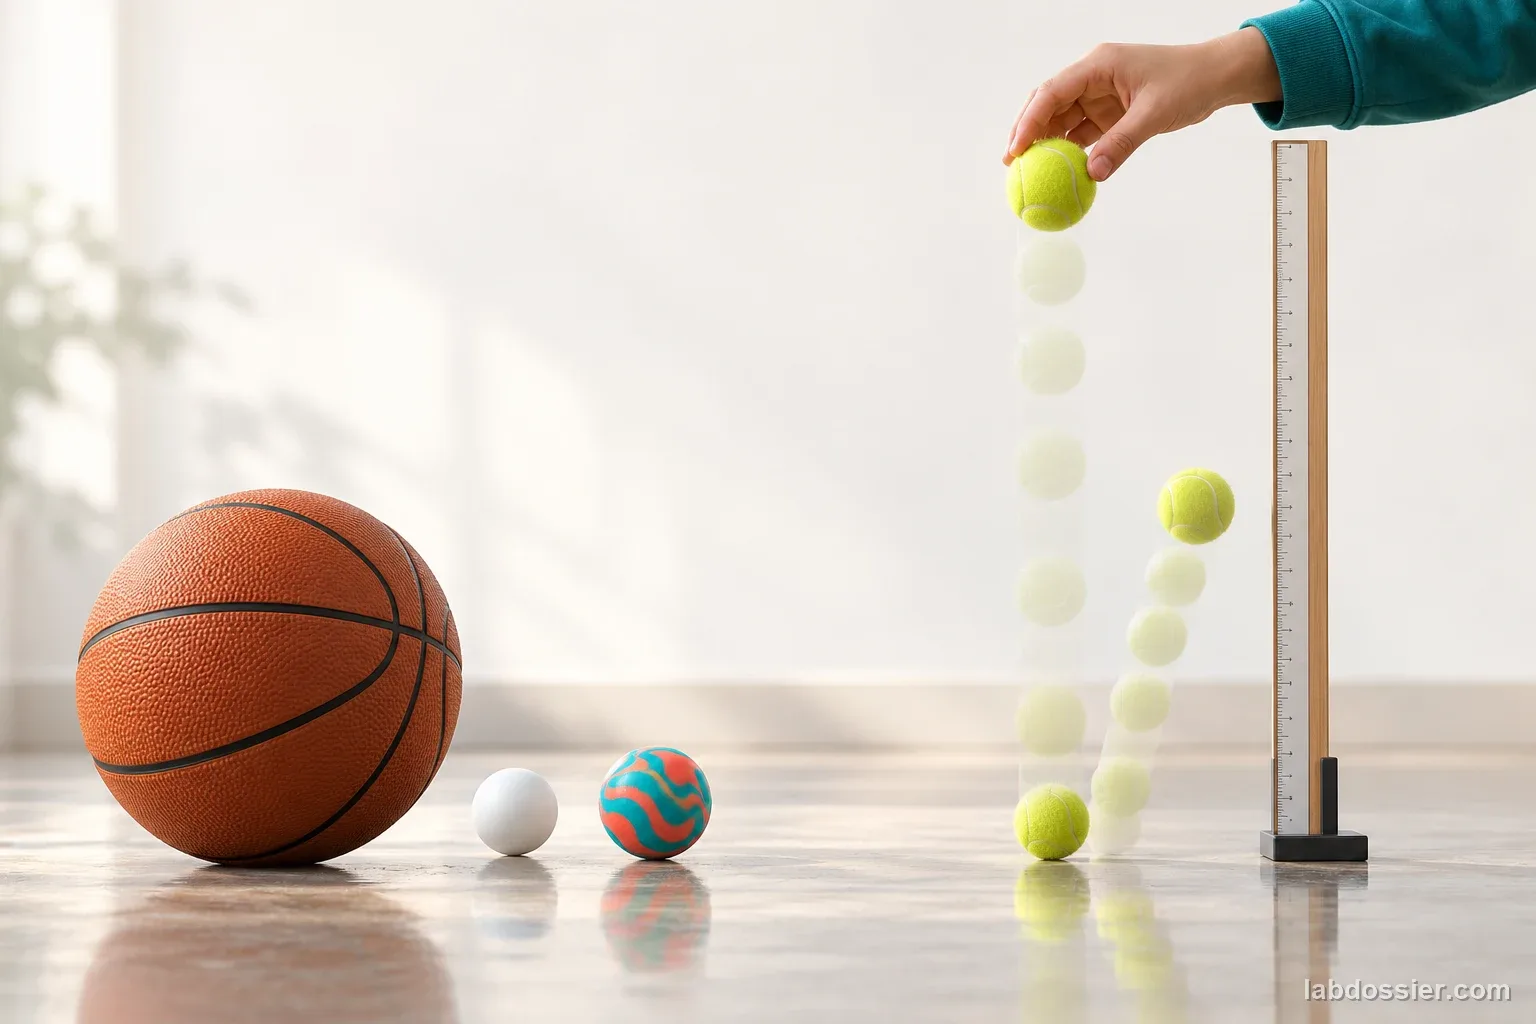
Bouncing ball energy lab
Drop several balls from the same height, measure each first rebound, and compare rebound height with release height in a controlled lab test.
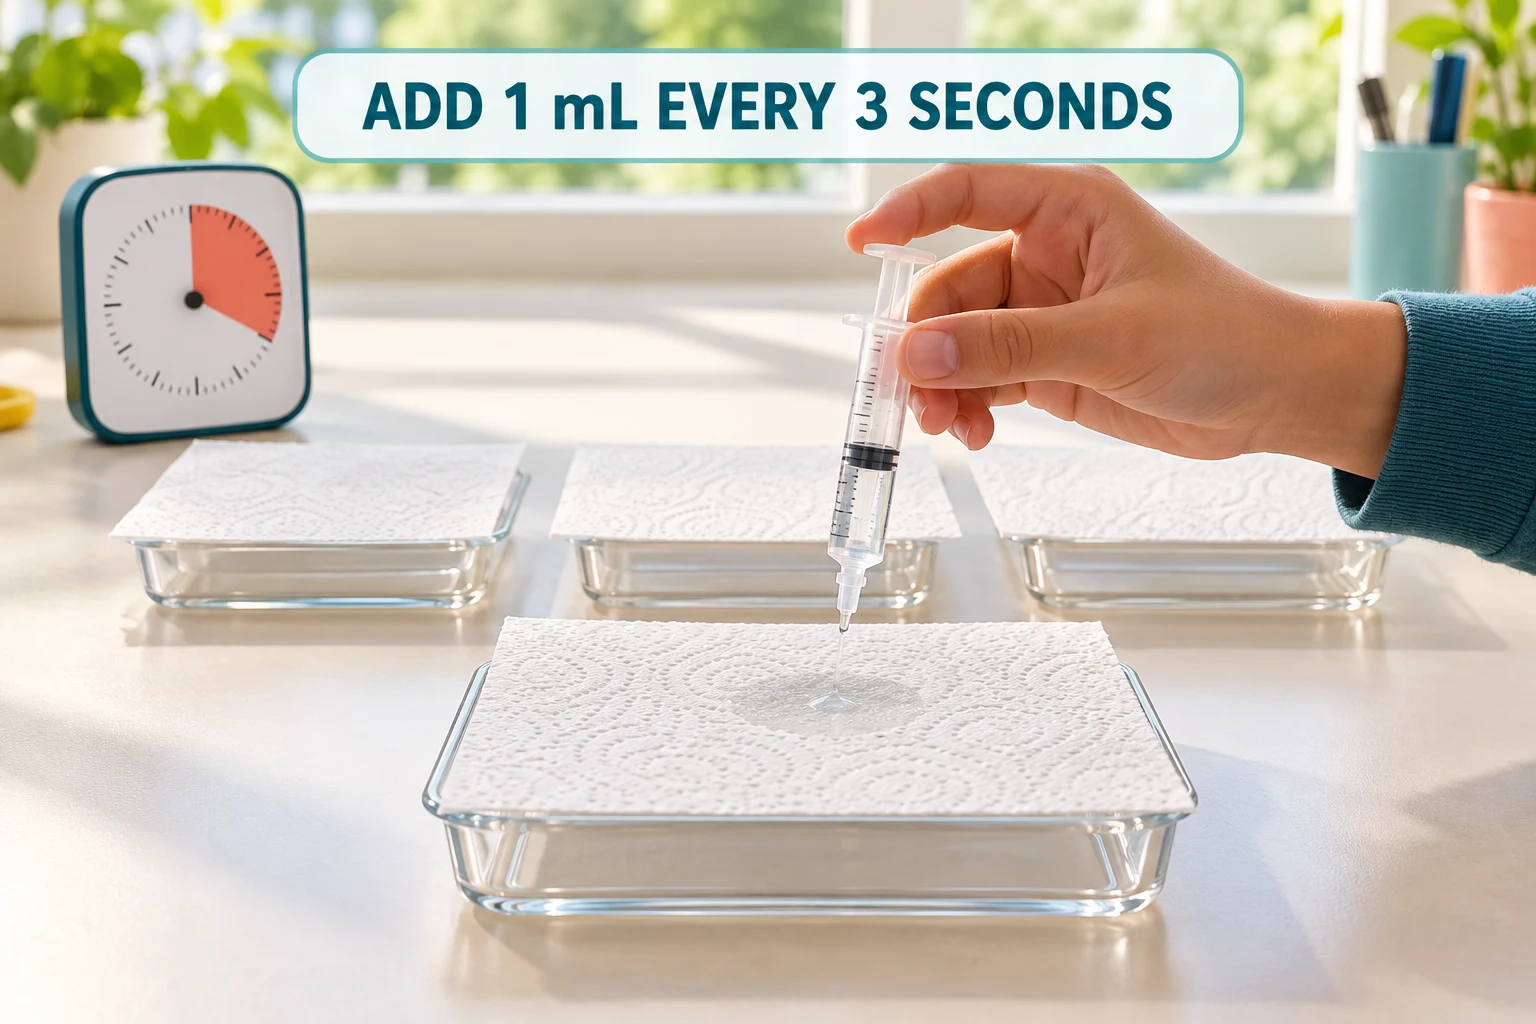
Paper towel absorbency lab
Compare three equal-area paper towel samples per product using a standardized 1 mL-per-3-second addition rate; record water added at the first visible drip, mean and range.
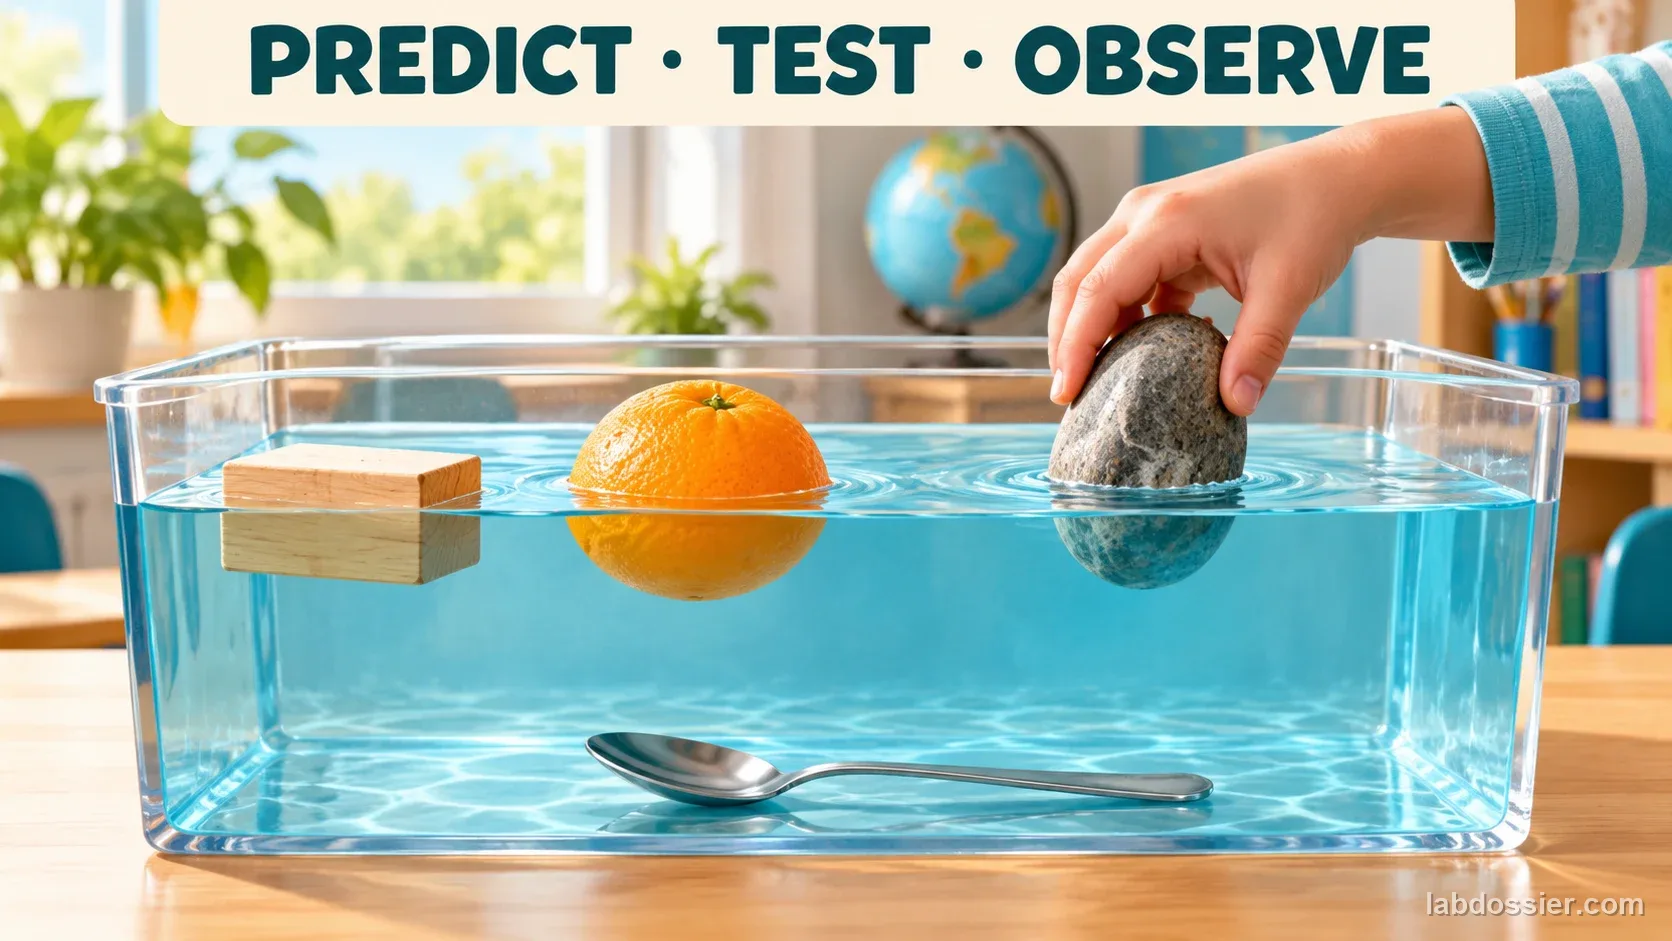
Sink or float lab
Test objects in water; use mass, volume, average density, shape, and trapped air to explain why each one floats or sinks in this lab activity.
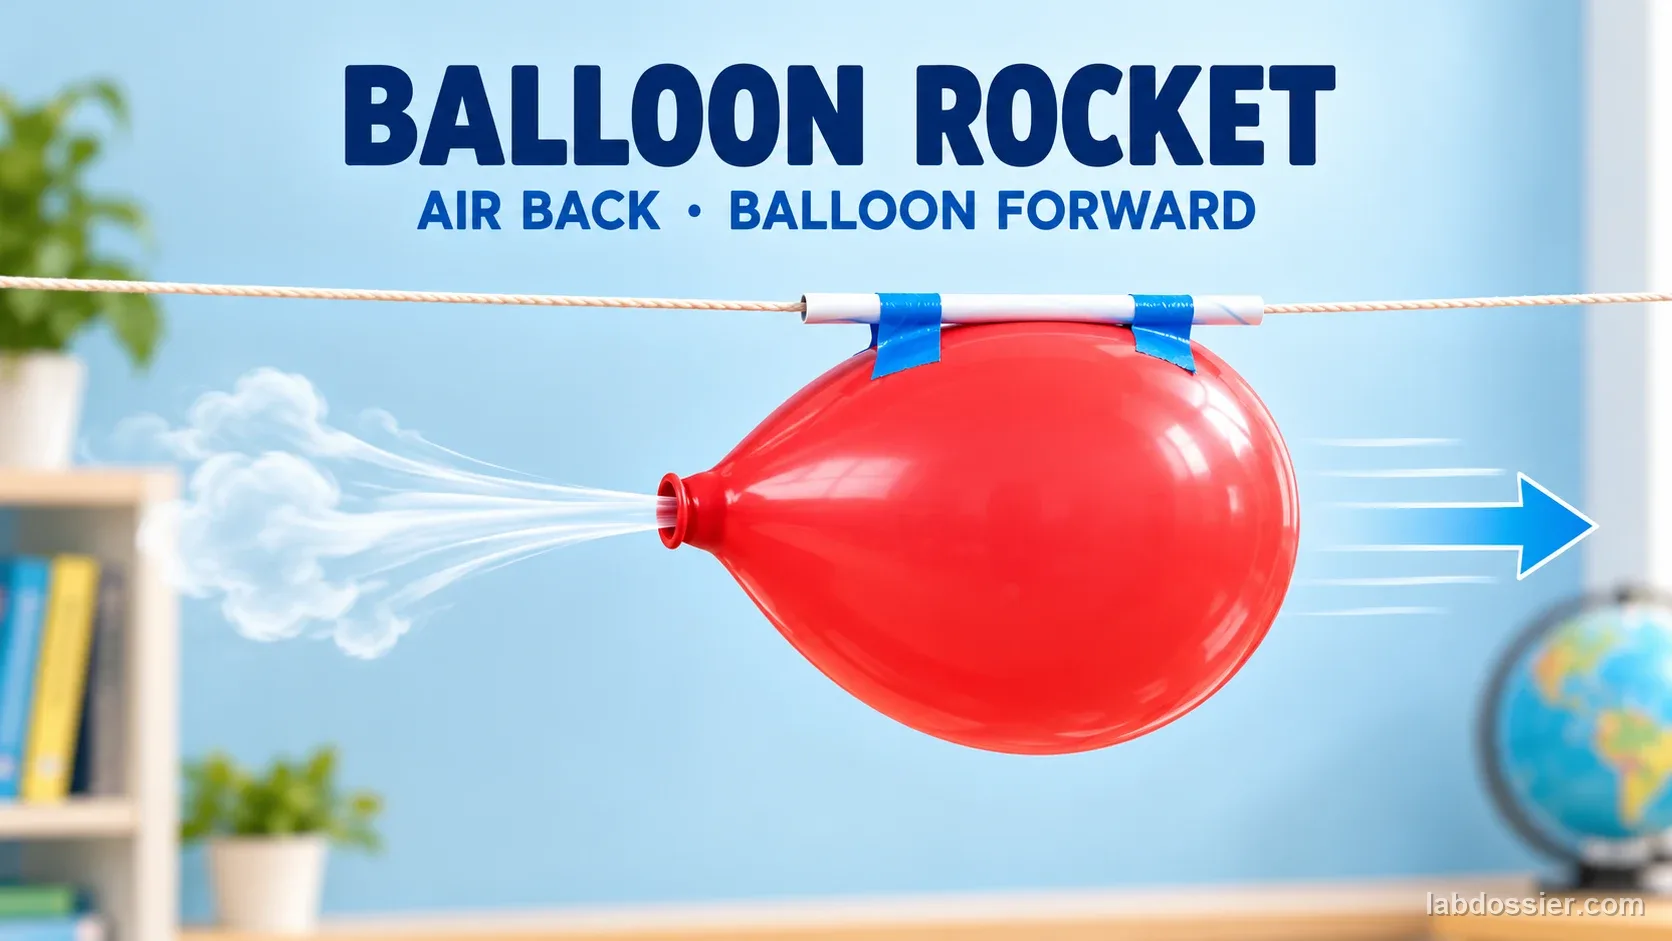
Balloon rocket lab
Measure starting balloon size, compare repeated launches along one taut track, and investigate how escaping air and friction affect travel distance.
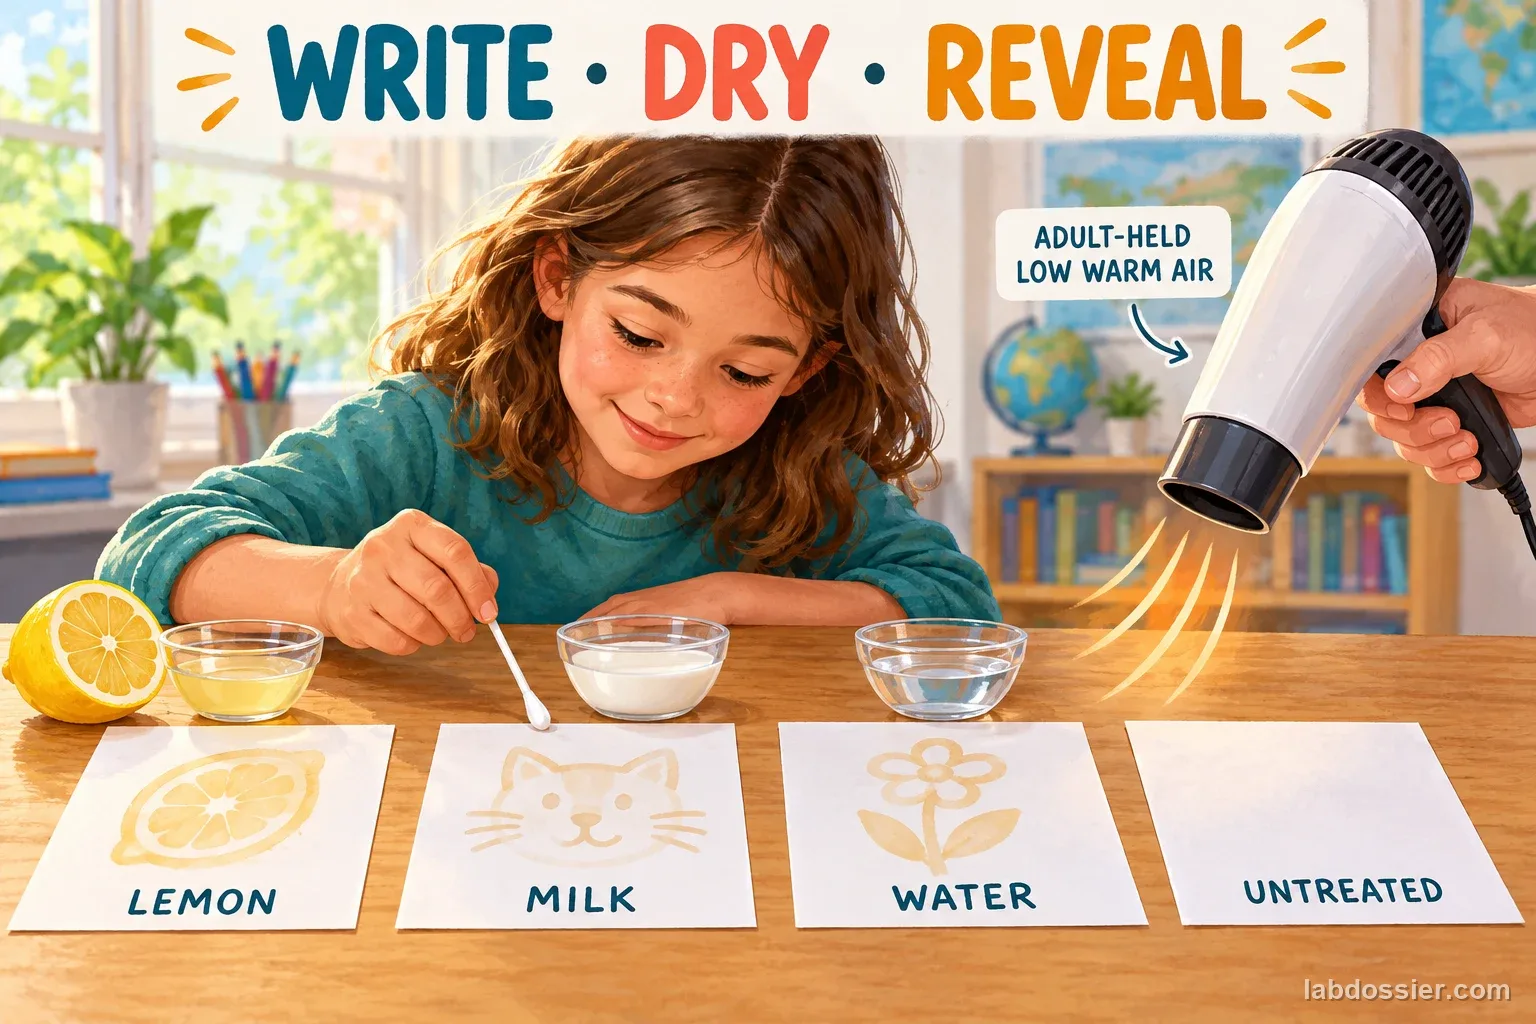
Invisible ink lab
Compare three matched trials of lemon juice, milk and plain water under the same adult-controlled warm-air treatment; keep raw times and summarize only complete results.
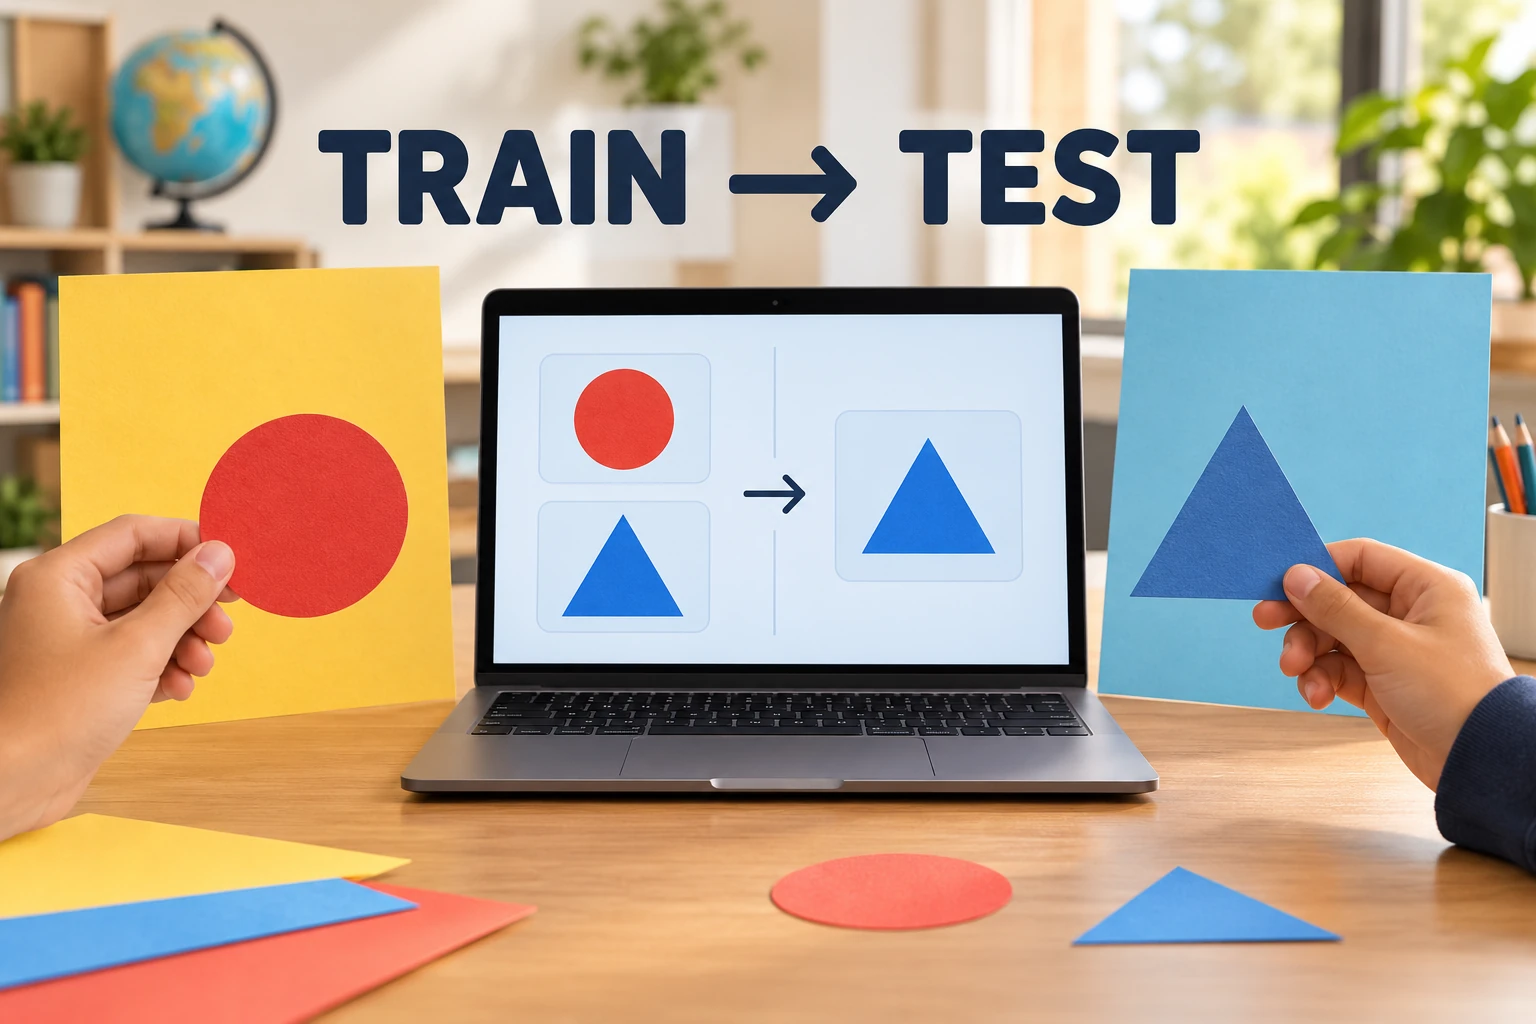
Does an AI image classifier recognize the object—or the background?
Run an AI image-classification experiment with held-out shape photos. Compare predictions on familiar, neutral and swapped backgrounds, record a confusion table, and explain why a classroom model cannot prove how all AI systems behave.
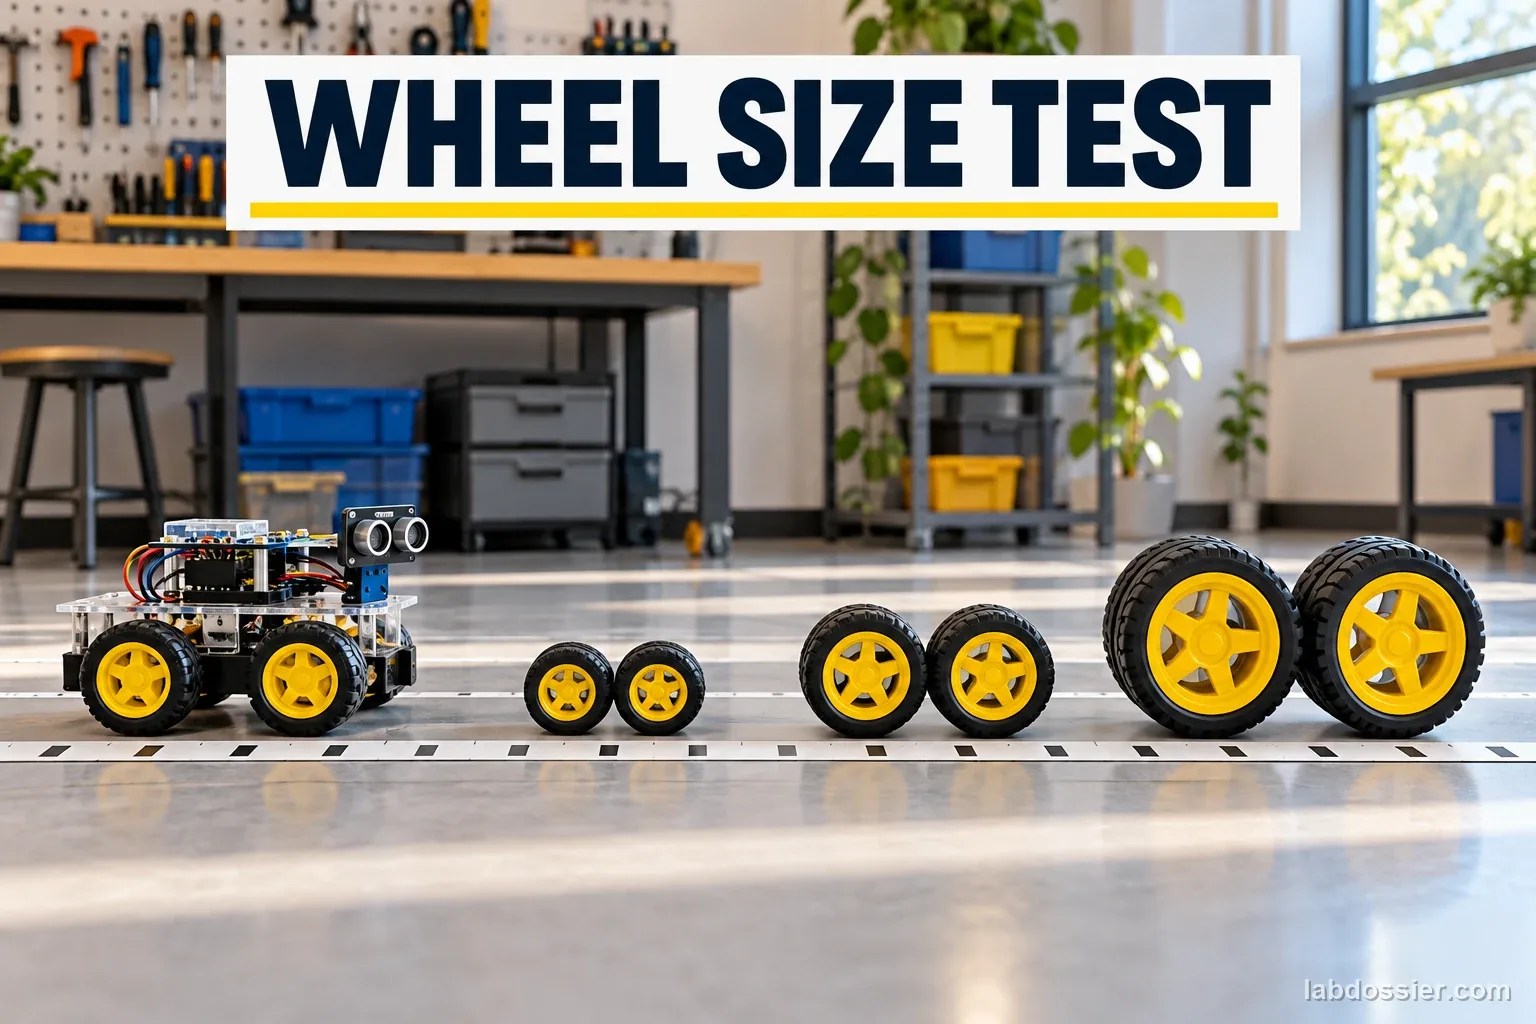
How does wheel size change a robot’s speed?
Test how wheel diameter affects a small robot’s measured speed. Keep its motor command, track, load and battery condition steady; repeat each wheel setup and compare measured travel with wheel circumference.
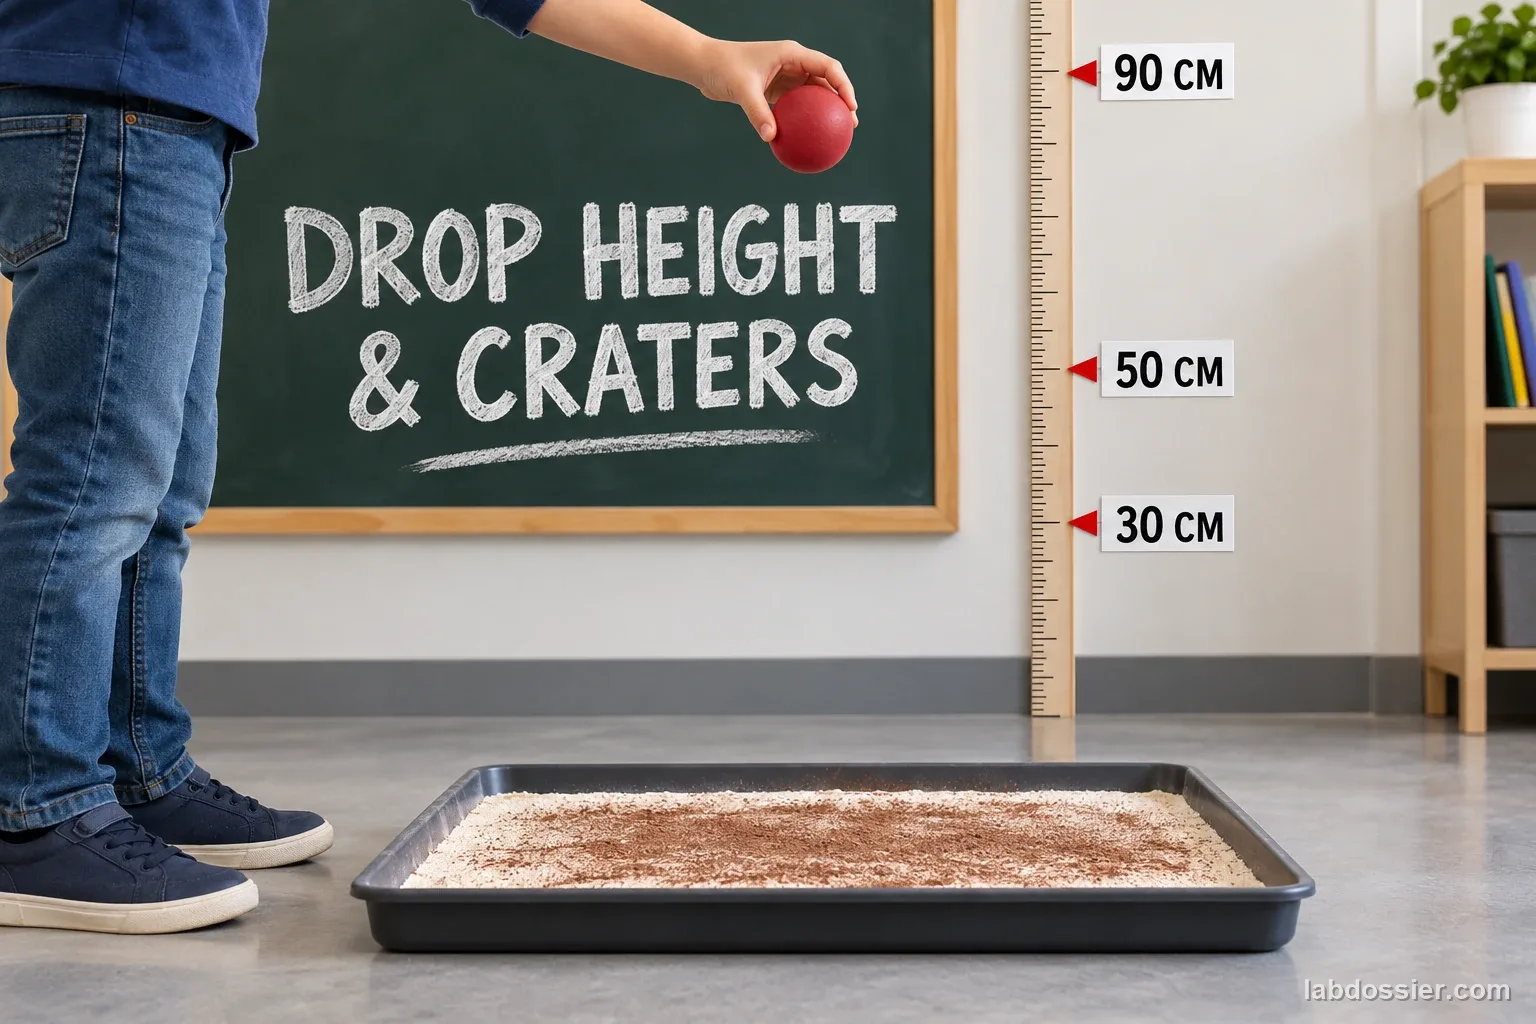
How does drop height change an impact crater?
Model a lunar impact-crater investigation by dropping the same ball from three measured heights. Repeat each condition, measure crater diameter and depth, and explain why flour cannot reproduce a real Moon impact.
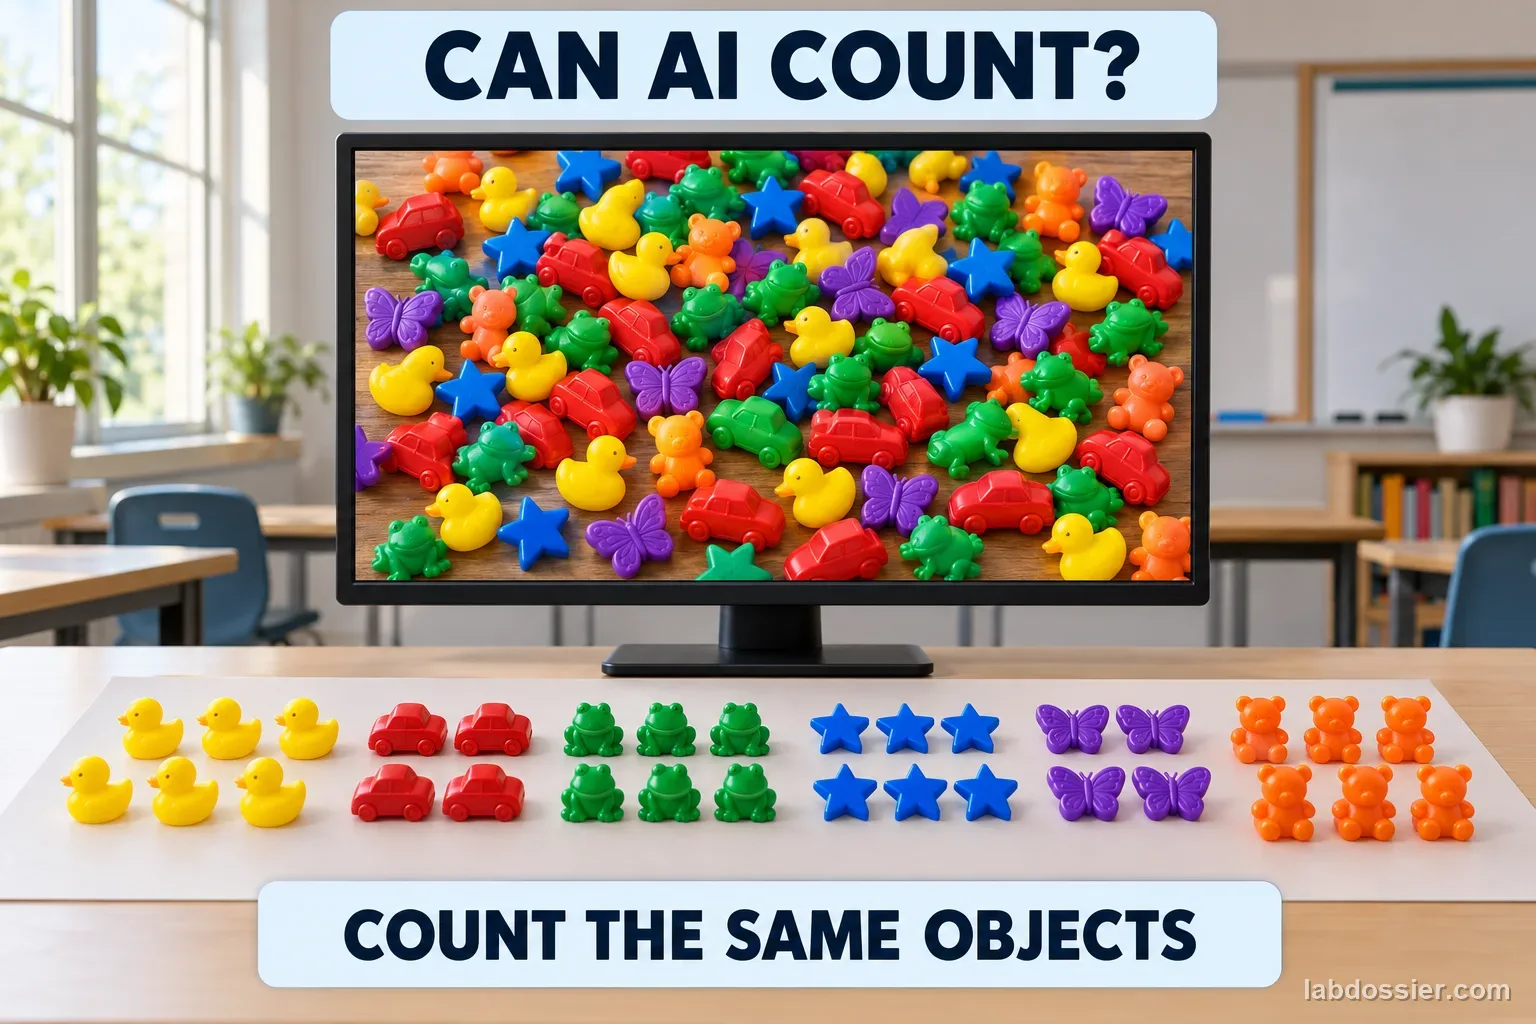
Can an AI vision model count objects when a picture gets cluttered?
Test the same kinds of objects in simple and cluttered pictures. Keep the verified count, record the model's estimate and compare absolute errors across image conditions.
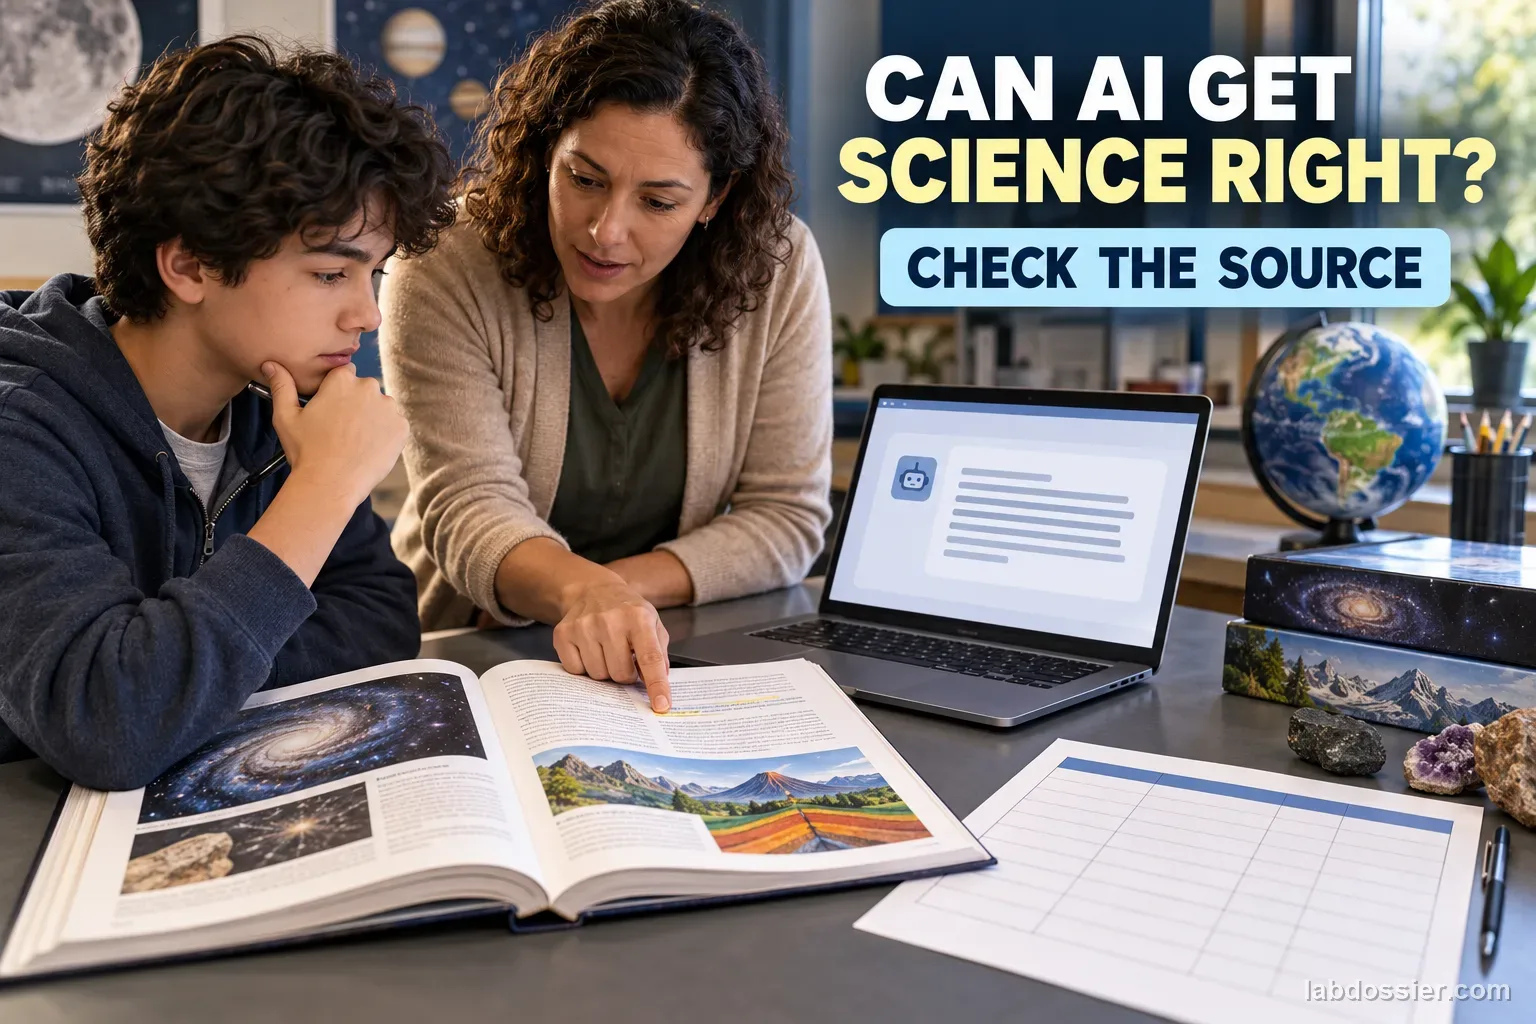
How often does AI answer a science question correctly—and can source checking help?
Prepare a science answer key from a trusted source before testing. Ask one AI model the same factual questions with and without that source, then score correctness, uncertainty and citation support separately.
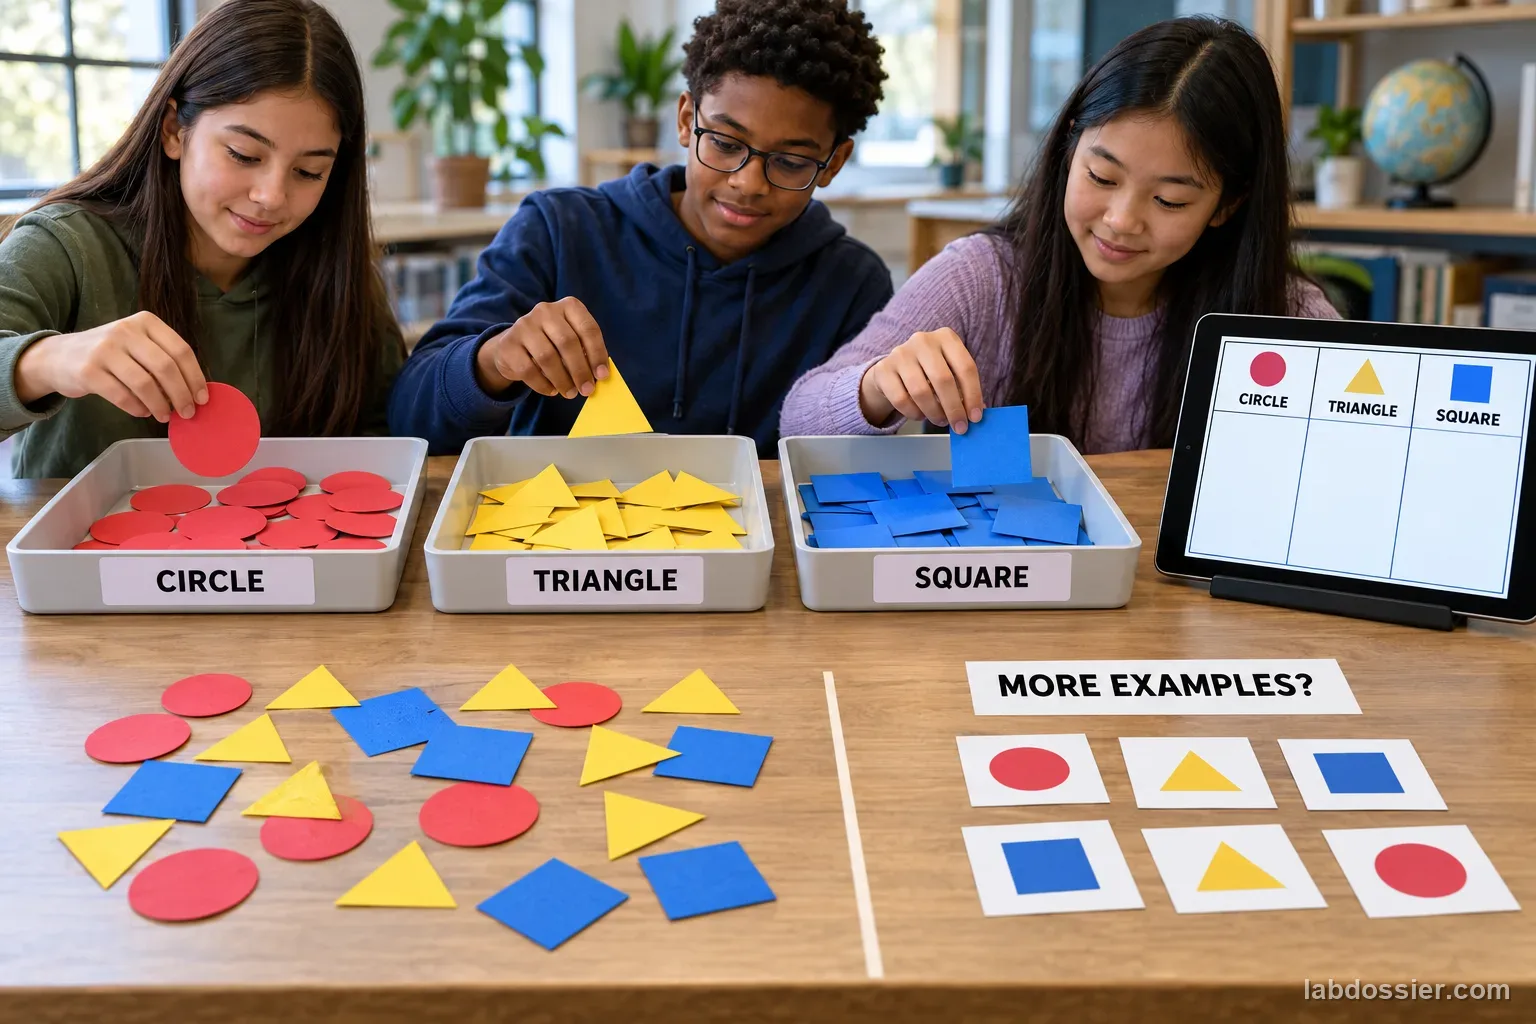
Does adding balanced training examples improve an image classifier on unseen examples?
Compare three balanced training-set sizes for a simple image classifier. Keep the classes, training conditions and independent test set fixed; report class-level results as well as overall accuracy.
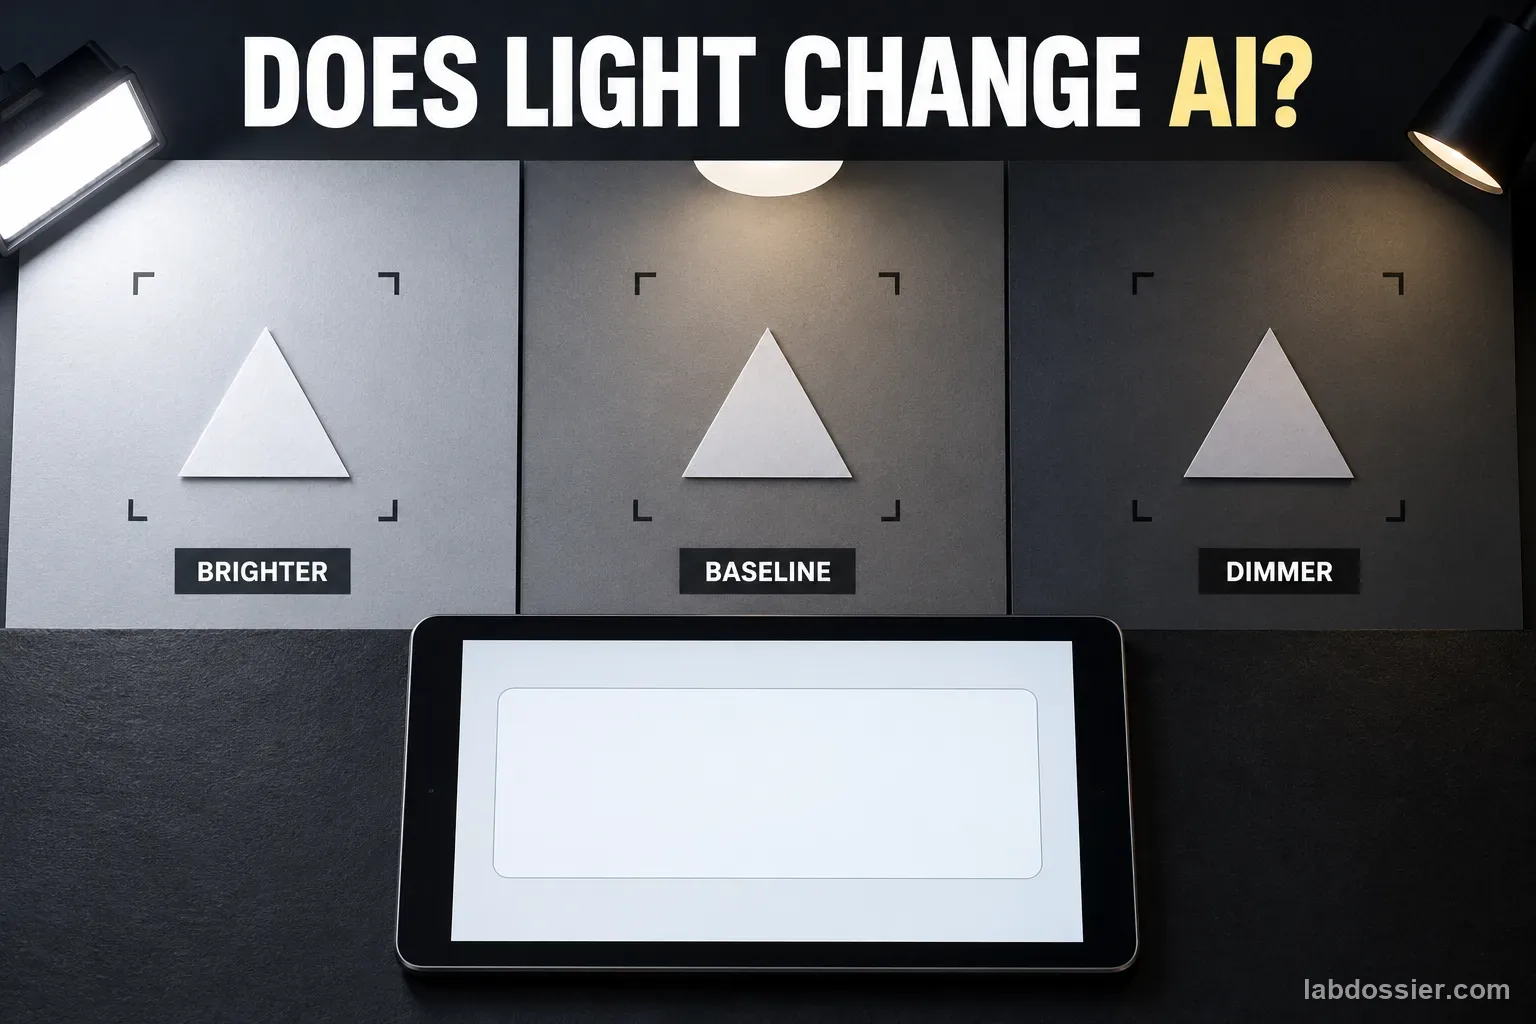
How does changing light affect an image classifier’s predictions?
Train one low-risk image classifier under steady diffuse light, then test the same held-out shape cards under brighter, baseline and dimmer conditions. Keep the camera, object and position fixed and record whether its label changes.

Can multimodal AI read values and trends from a graph accurately?
Test chart reading with 12 charts built from known values. Ask the same three questions about a value, a trend and a change; score numeric errors separately from trend labels and compare chart types.
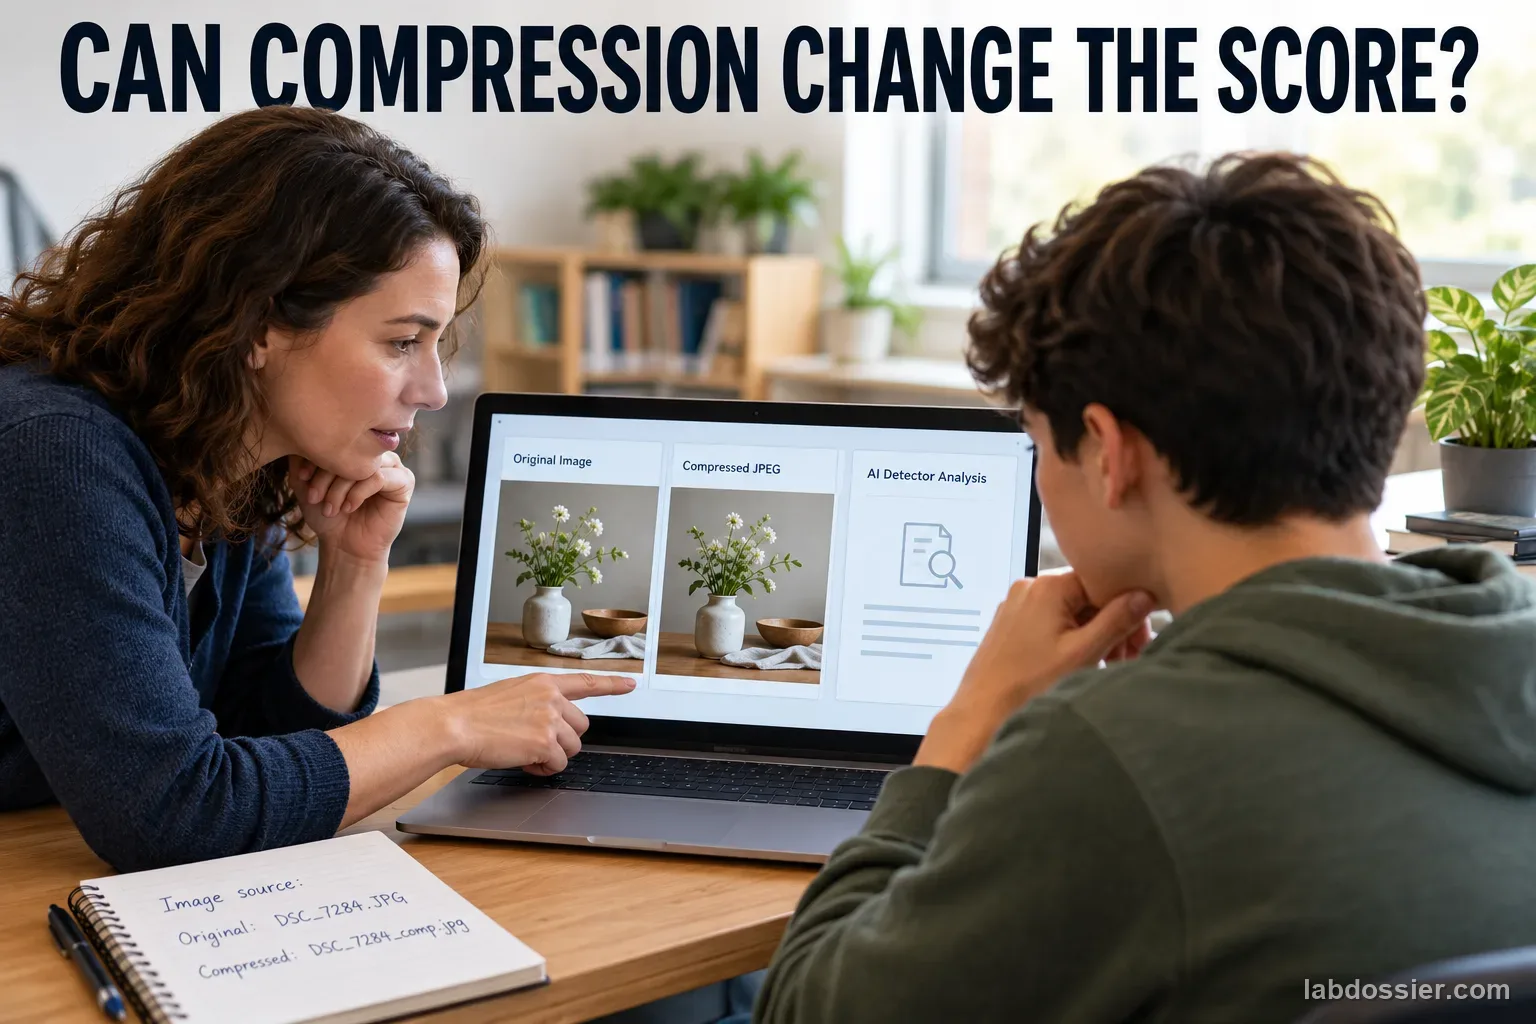
Can image detectors still recognize AI images after compression?
Use 12 non-identifying images with verified origins. Test each original and two JPEG copies with one fixed AI-image detector, then compare sensitivity, false positives and score changes without treating a detector result as proof.
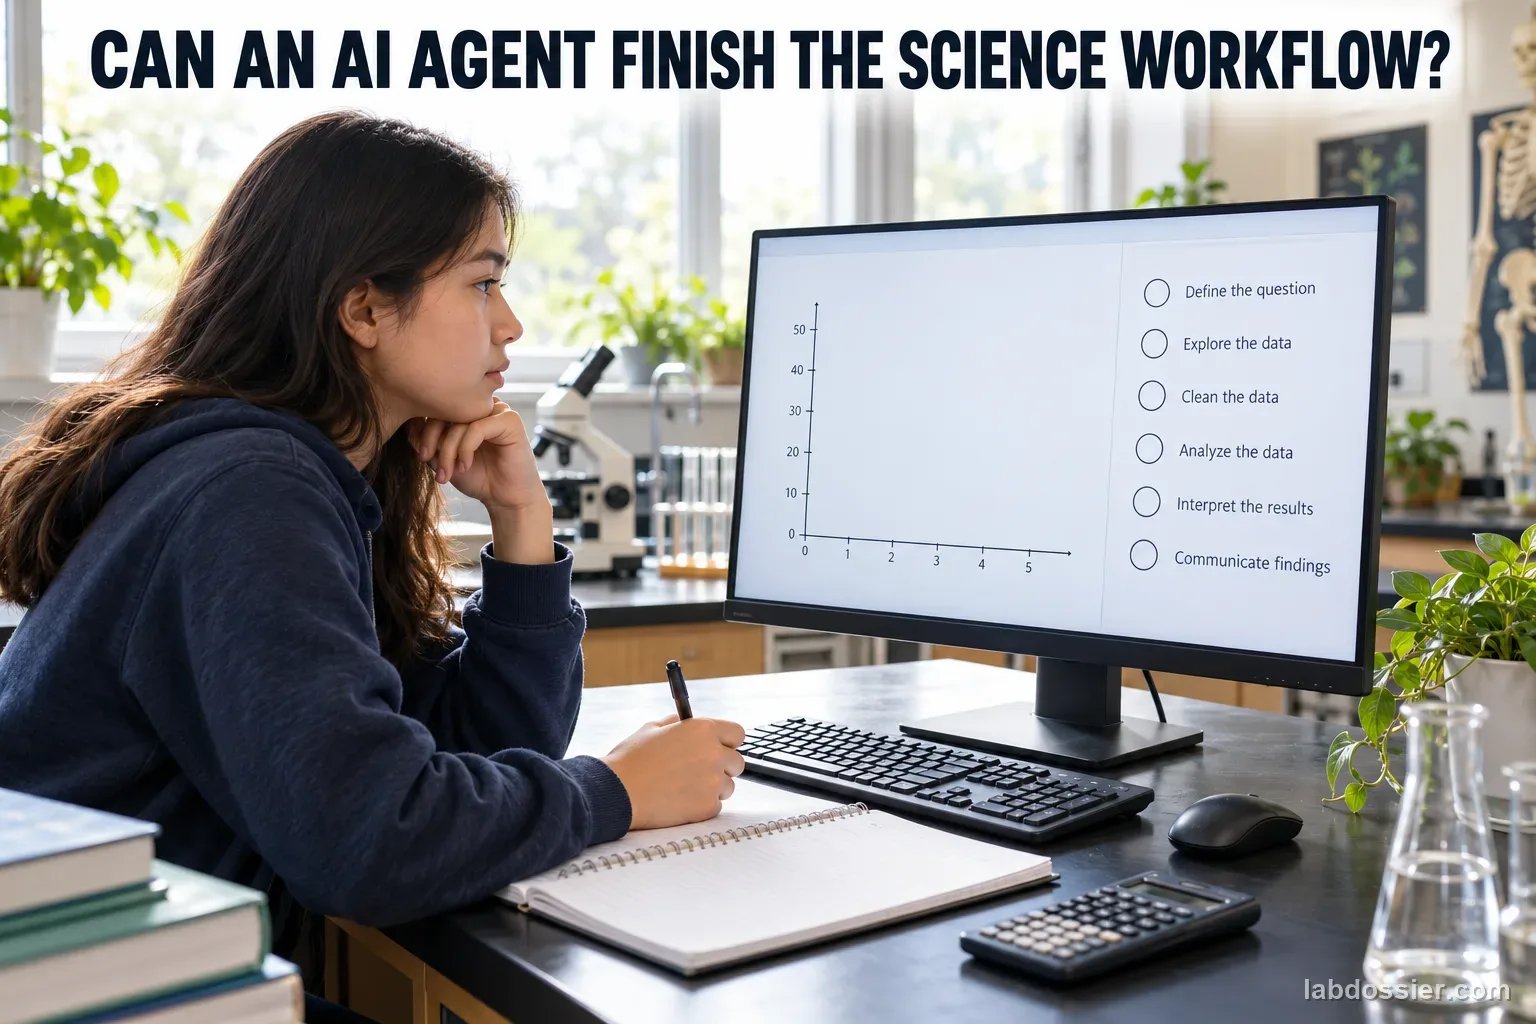
How reliably can an AI agent complete a multi-step science-data task?
Test one teacher-approved AI agent on a fixed, synthetic plant-growth dataset. Check data reading, units, calculations, graph creation and evidence-based interpretation across five fresh runs; no live files or outside actions are allowed.
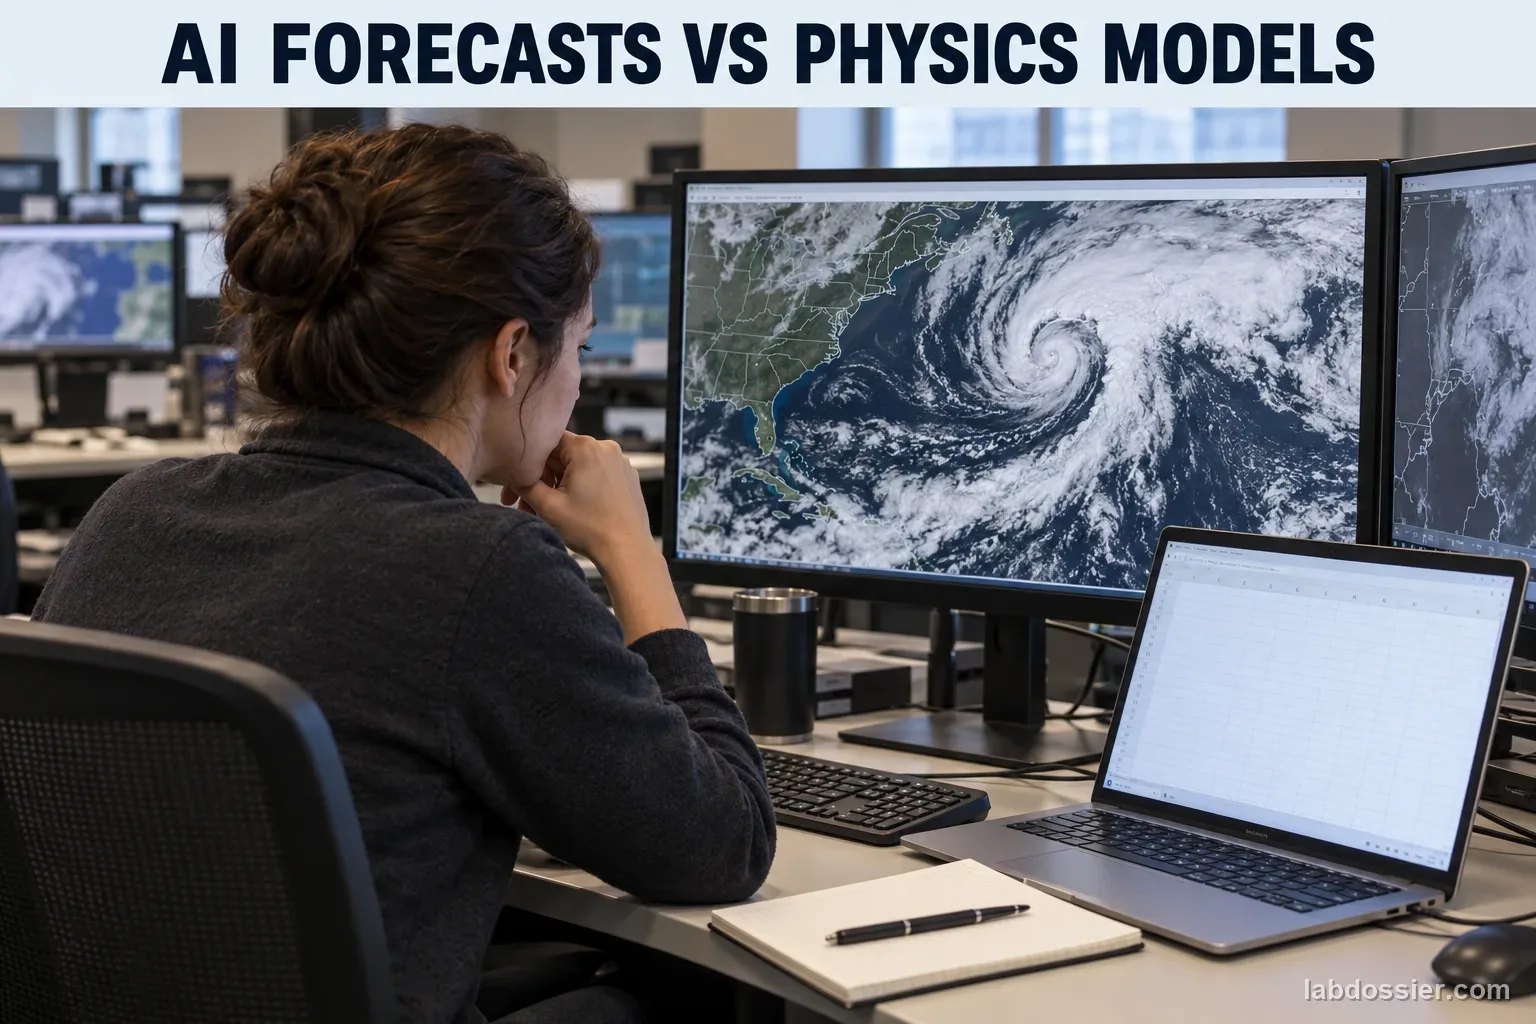
How do AI and conventional weather forecasts compare on the same dates?
Compare 24-hour-ahead daily maximum temperatures from ECMWF's AI-based AIFS and physics-based IFS on 14 matched dates. Score both against the same ERA5 reanalysis reference and keep model, grid, lead time and uncertainty visible.

How do data-center cooling designs trade water use against electricity?
Compare three modeled cooling configurations for the same hypothetical 200 MW IT data center in Michigan. Recalculate changes in annual facility electricity, direct cooling-water consumption and indirect power-generation water; then explain why modeled results are not measurements or a universal design ranking.
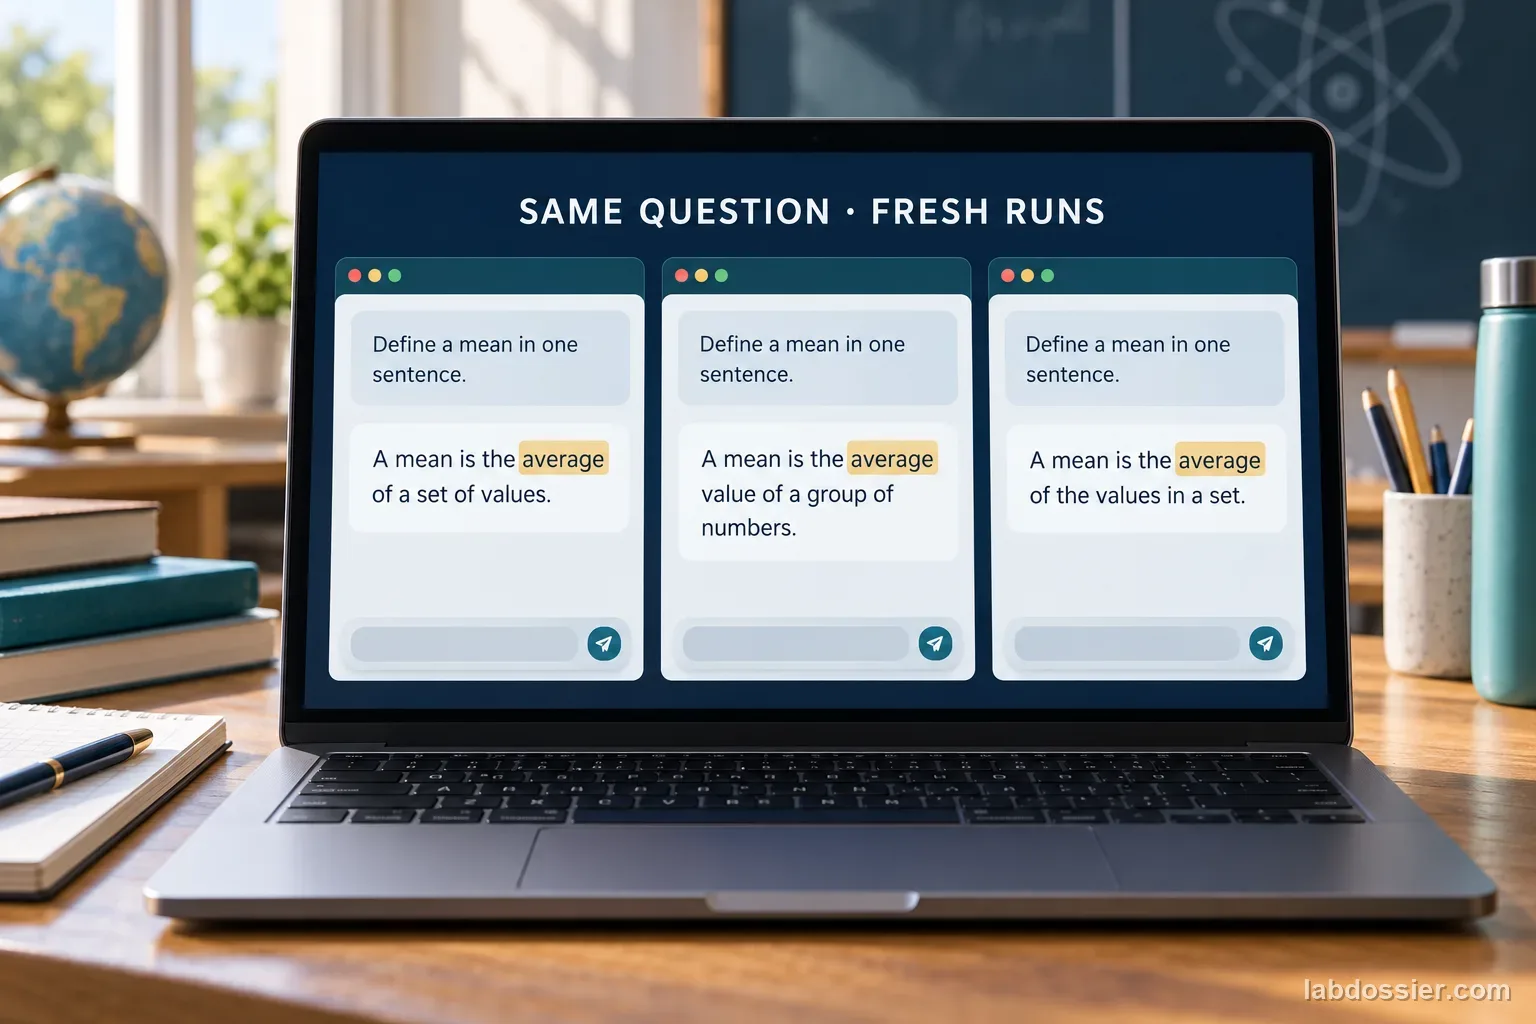
Does an AI answer stay the same when you repeat or reword a prompt?
Compare repeated outputs from the same AI tool under a fixed prompt, then compare a carefully reworded version. Save each response, score factual accuracy against a teacher-checked source and keep repeatability separate from correctness. The small sample measures one tool, task and date; it cannot establish a universal reliability rate.
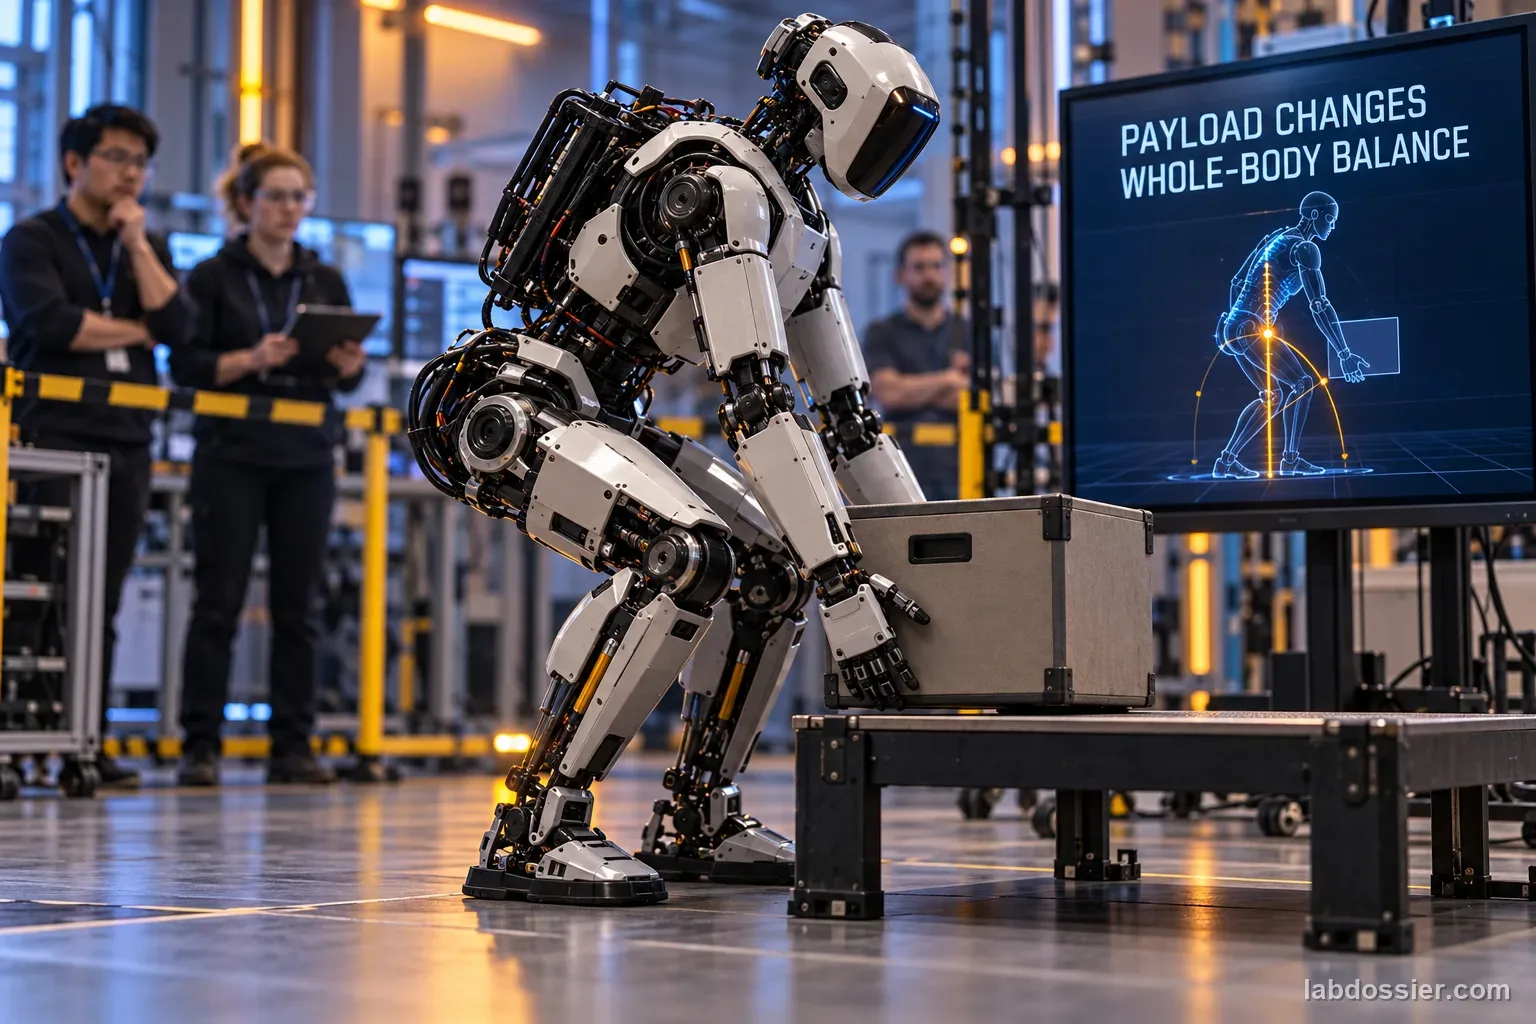
How does a carried payload change humanoid balance and recovery?
Compare recent humanoid payload studies, extract one study's reported stability thresholds and distinguish modeled balance capability from a robot's maximum rated payload. Track how load, center of mass, support area, posture, actuation and task affect recovery; do not treat results from different platforms as a direct ranking.
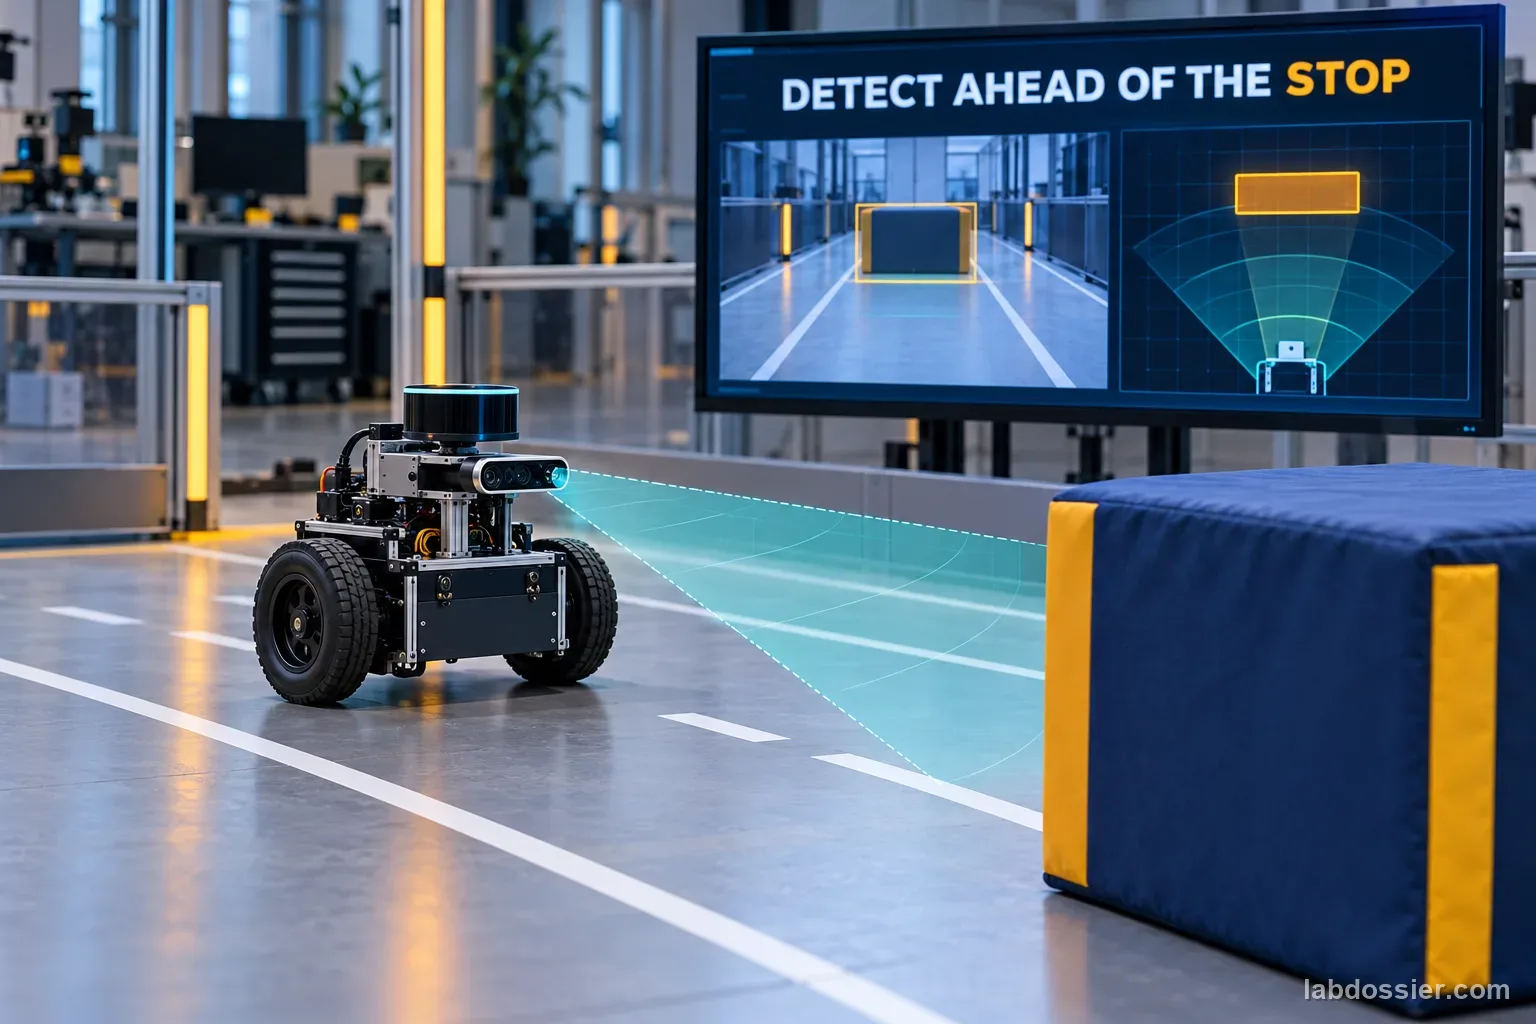
How far ahead must a mobile robot detect an obstacle to stop?
Use a recent differential-drive robot study's estimated 90%-success reaction distances across five maneuvers and three speeds. Calculate the difference between the study's commanded maneuver distance and a sensor-to-obstacle stopping envelope, which must also account for sensor/control latency, braking, robot footprint and uncertainty. This paper is a one-robot tile-floor preprint; its results are not a safety distance for other systems.
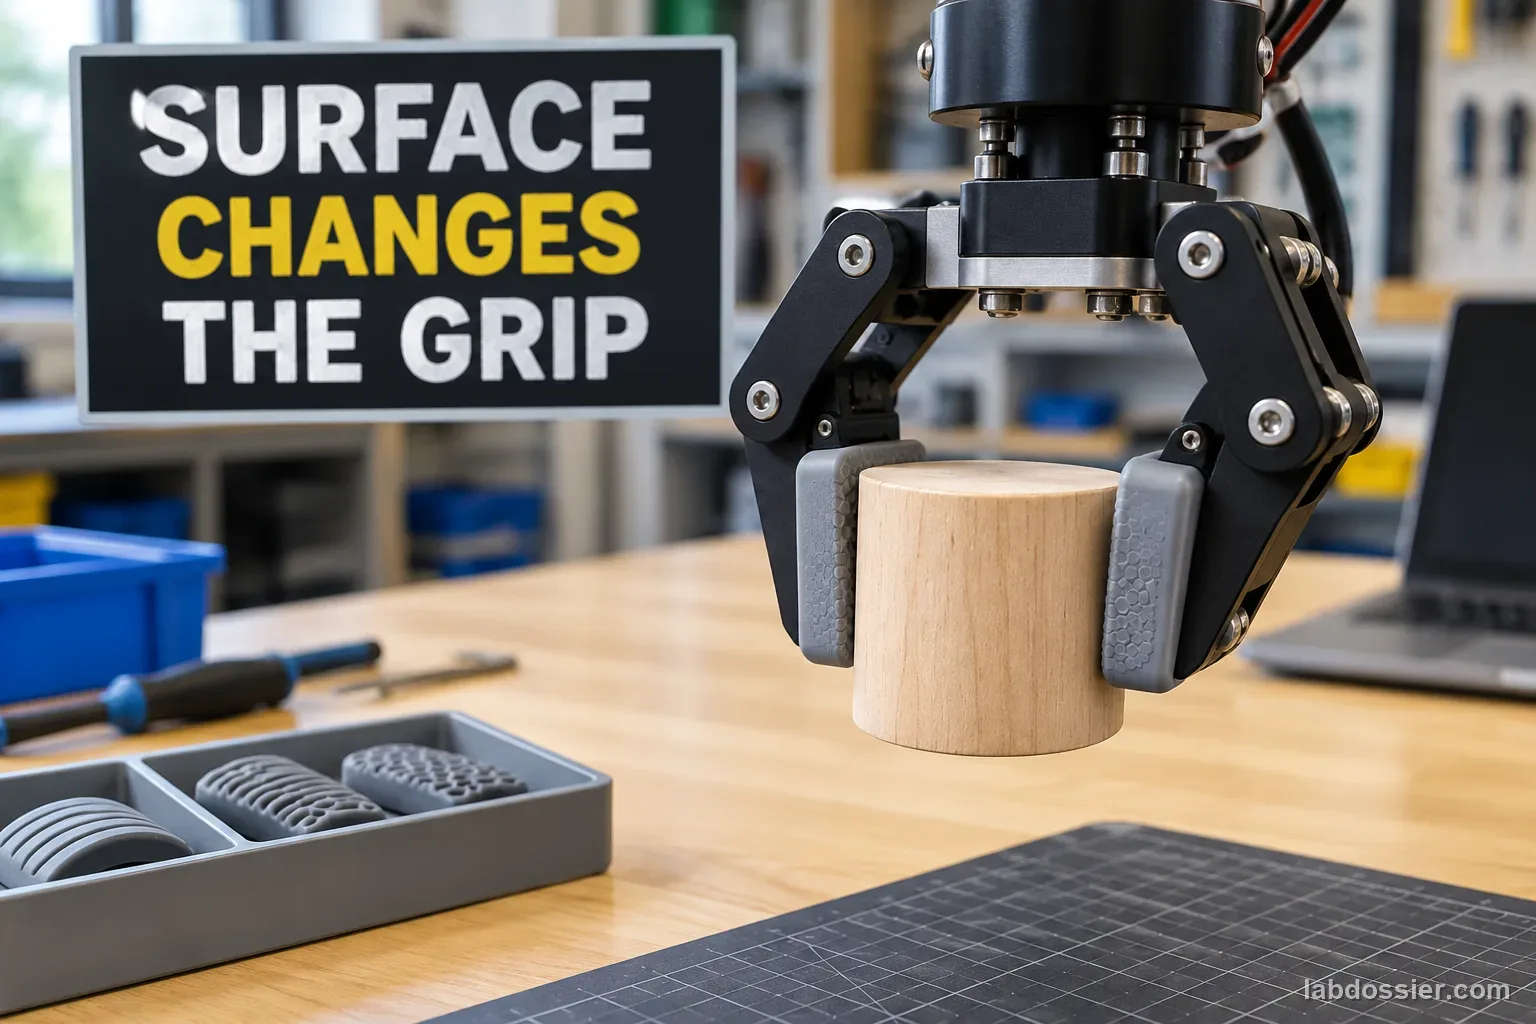
Which gripper surface holds an object with the least slip?
Test a fixed classroom gripper with replaceable smooth paper, foam and silicone-like pads. Hold the same light cylinder at a measured grip force, increase a gentle downward pull, and record the force at first 5 mm of slip across repeated trials. Compare material performance only for this object, dry condition and gripper setup.
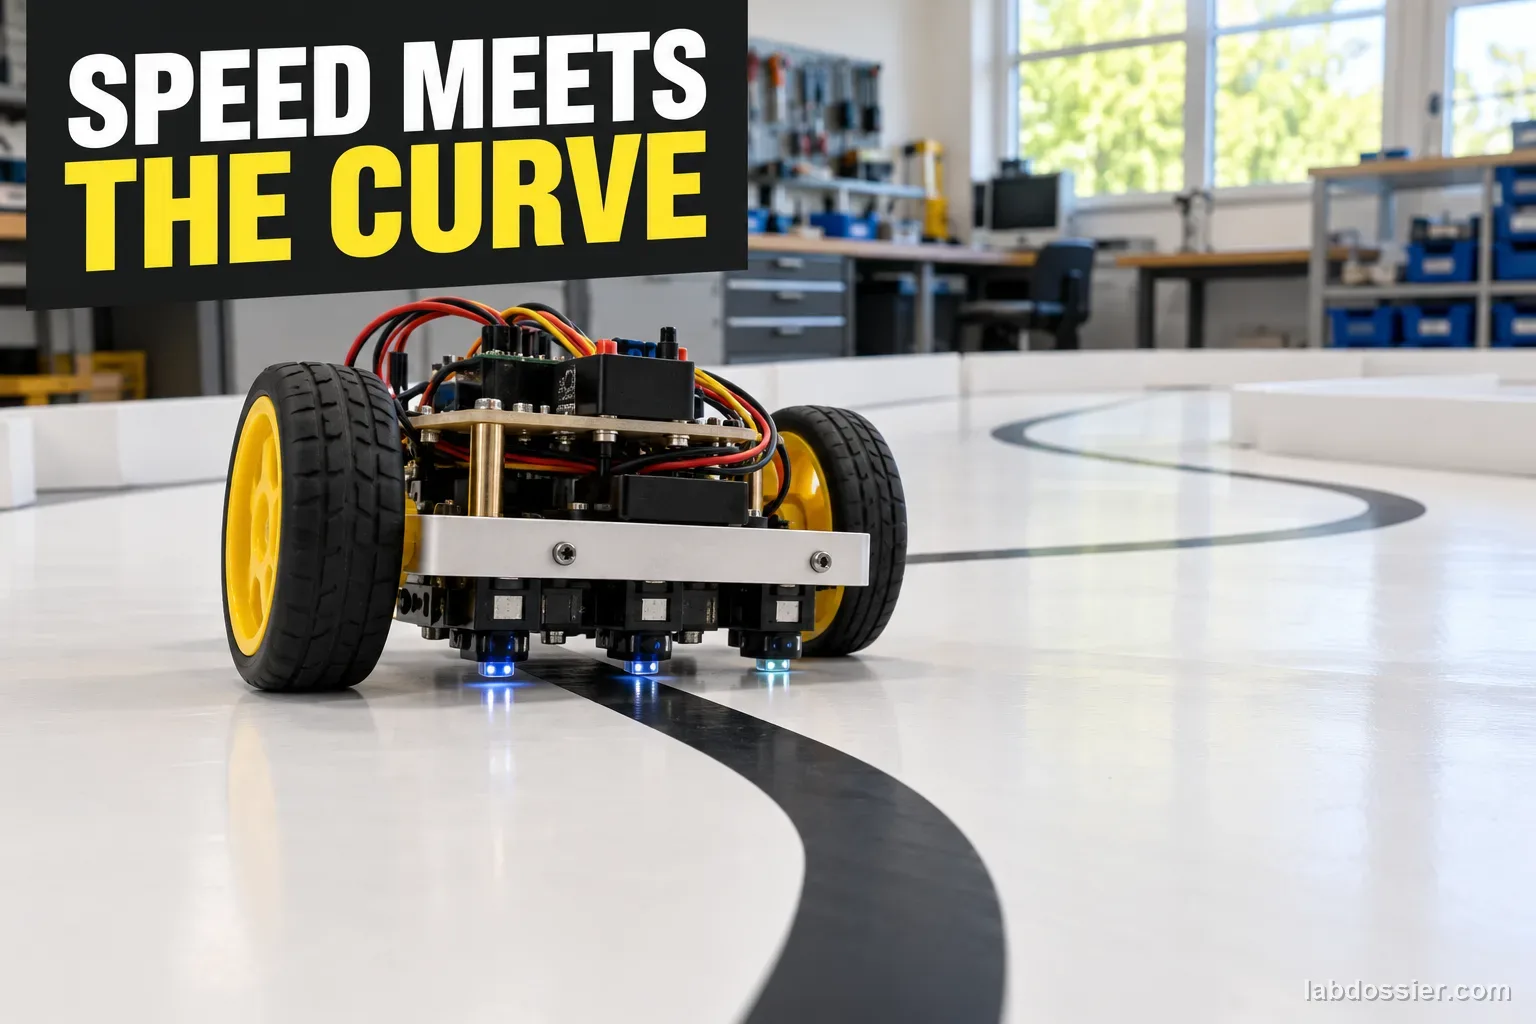
How does speed affect a line-following robot on tighter curves?
Run one approved line-following robot through three measured curve radii at three instructor-approved speed settings. Repeat each combination five times, record whether the robot completes one lap without losing the line and measure lap time. Keep the robot, track material, lighting, line width and controller fixed so results describe only this setup.
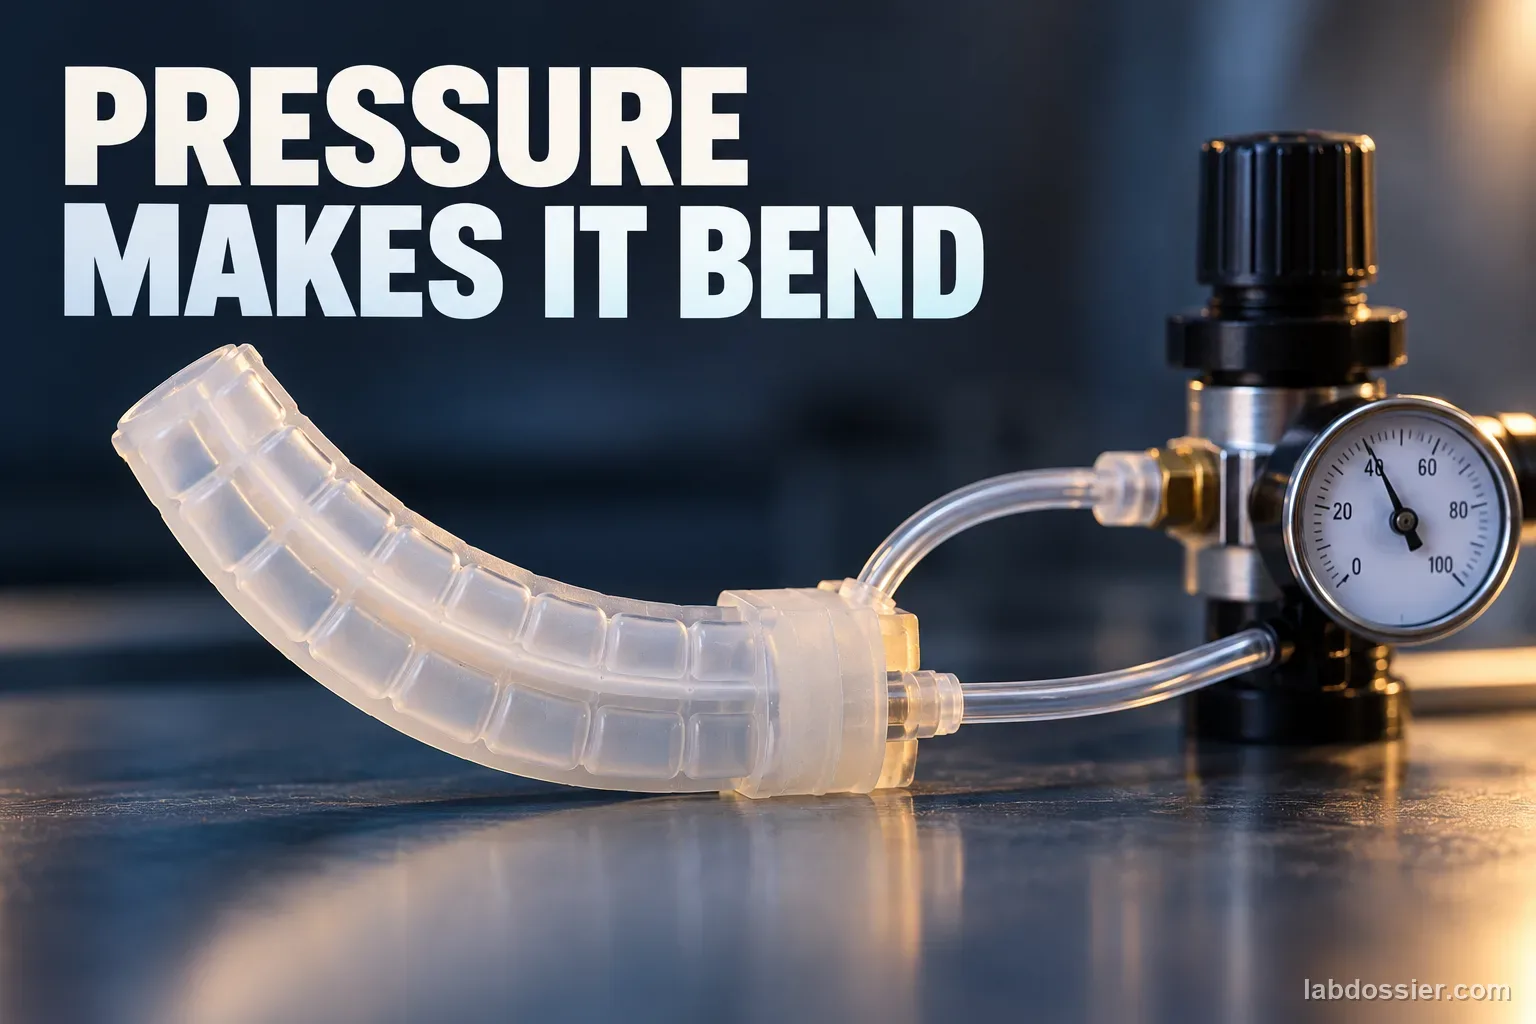
How does air pressure change the bend of a soft-robot actuator?
Analyze published experiments on soft pneumatic actuators. Extract only the source-reported pressure and bending measurements, compare dissimilar designs without ranking them, and explain why geometry, material, loading history and pressure limits shape every pressure-to-bend curve. This is a published-data investigation; it does not ask learners to build or pressurize an actuator.
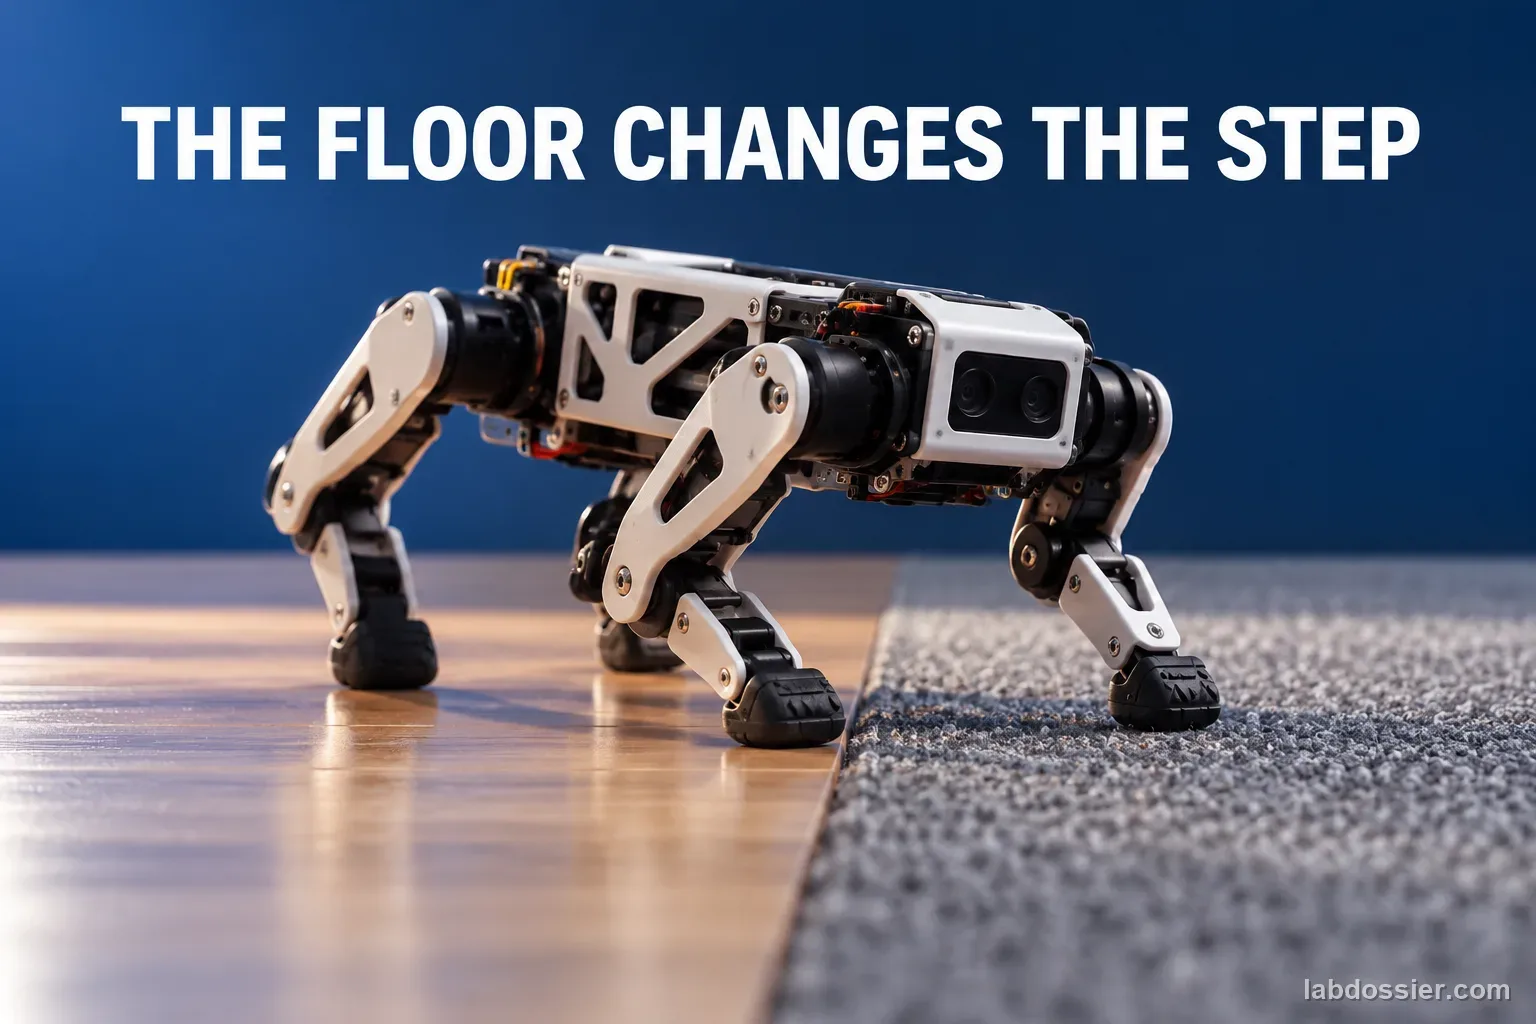
How does floor texture affect a small legged robot's traction and walking?
Run a teacher-approved, lightweight classroom quadruped over a short, level course made from three dry surface panels. Hold gait, robot, feet, battery condition, distance and start position constant. Repeat each surface five times and compare completion time, distance and visible stance-foot slip. A classroom slip count is not a friction coefficient or a robot safety rating.
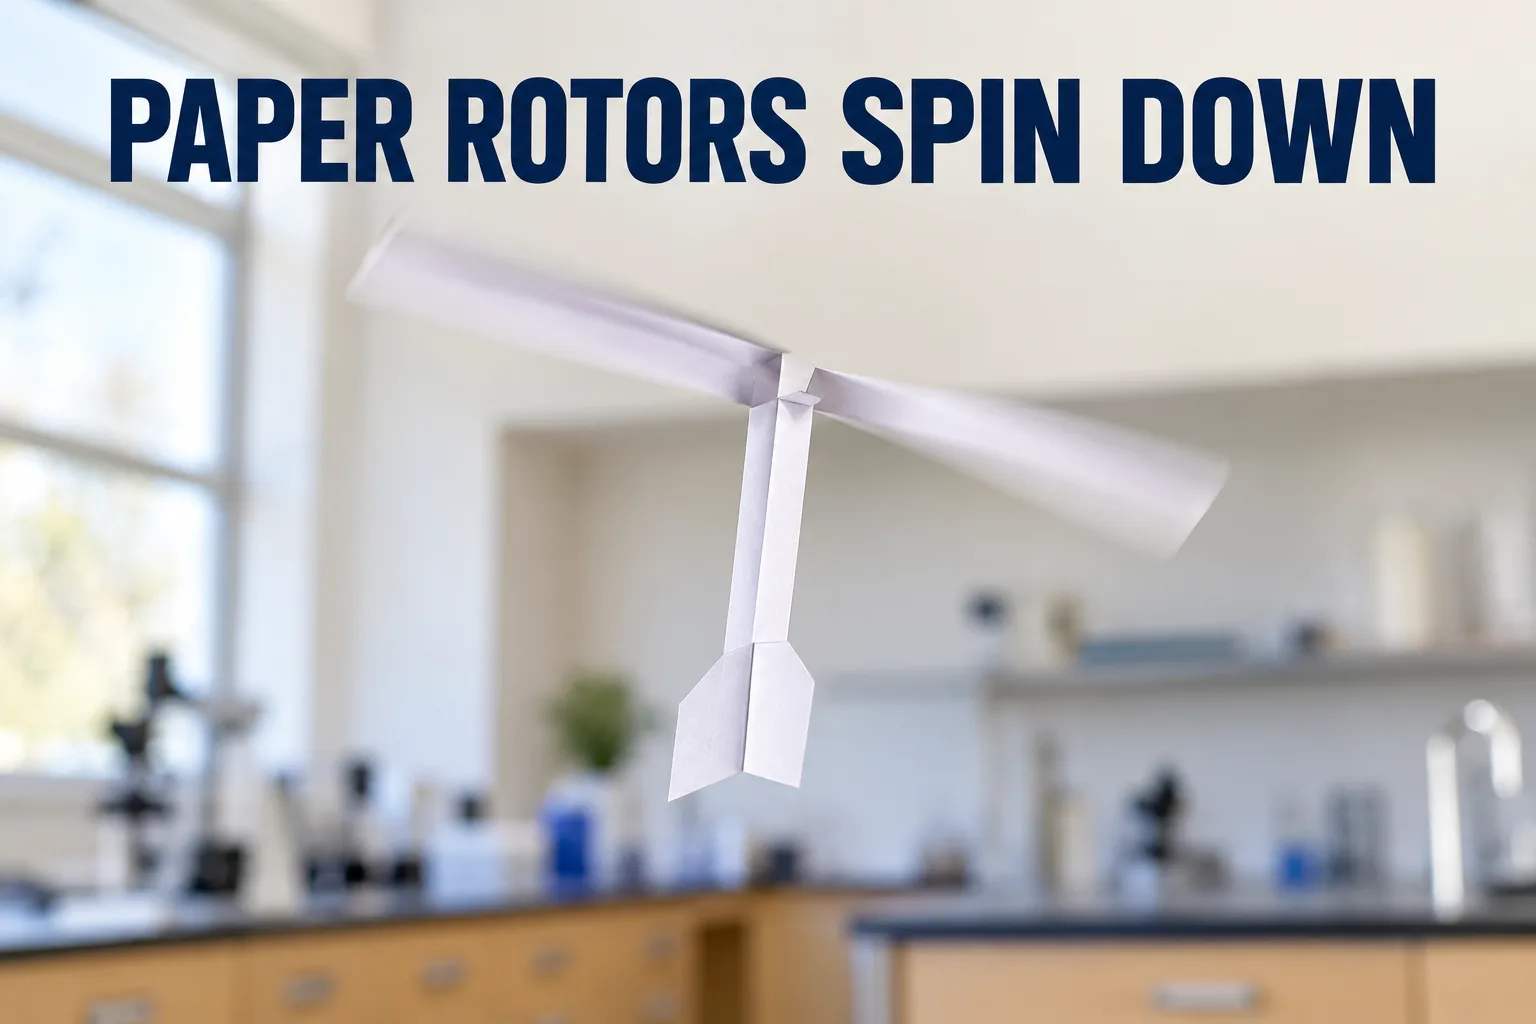
How do paper rotor dimensions affect fall time and stability?
Compare two paper-rotor blade widths and three lengths using five drops per design. Keep paper, body, release height and method fixed; record flight time and a separate stability observation.
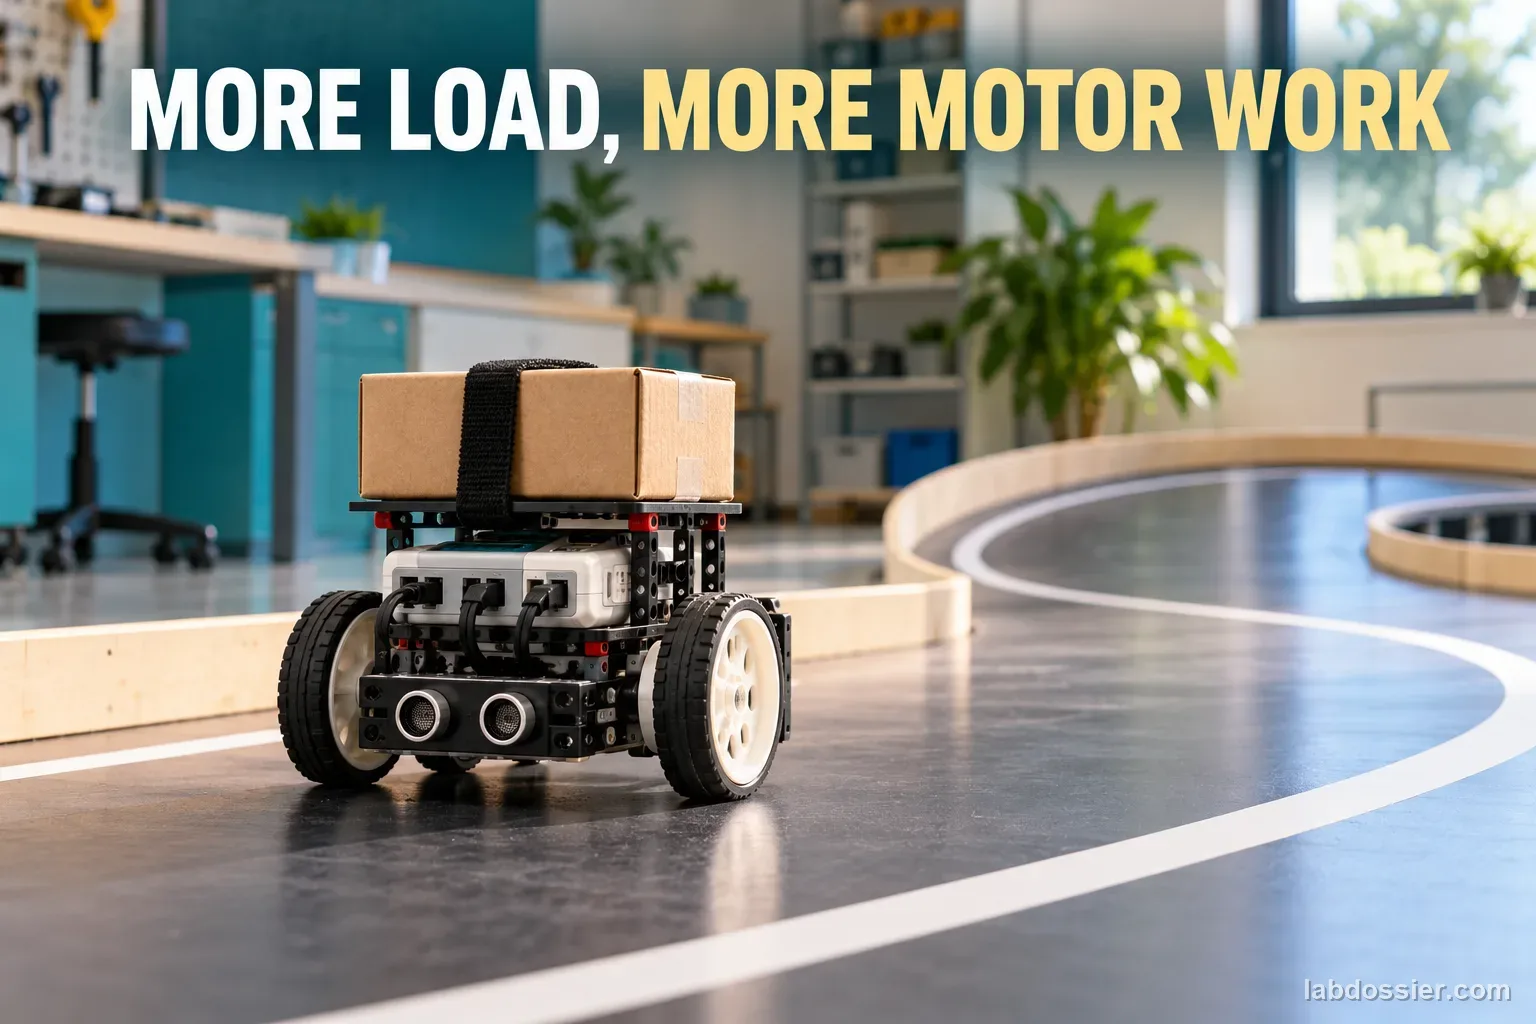
How does payload change a robot's battery endurance?
Compare a manufacturer's-approved low payload range on one repeatable ground-robot route. Record time and laps until the first normal low-battery warning; stop there, recharge only as directed, and treat the warning time as a platform-specific endurance proxy.
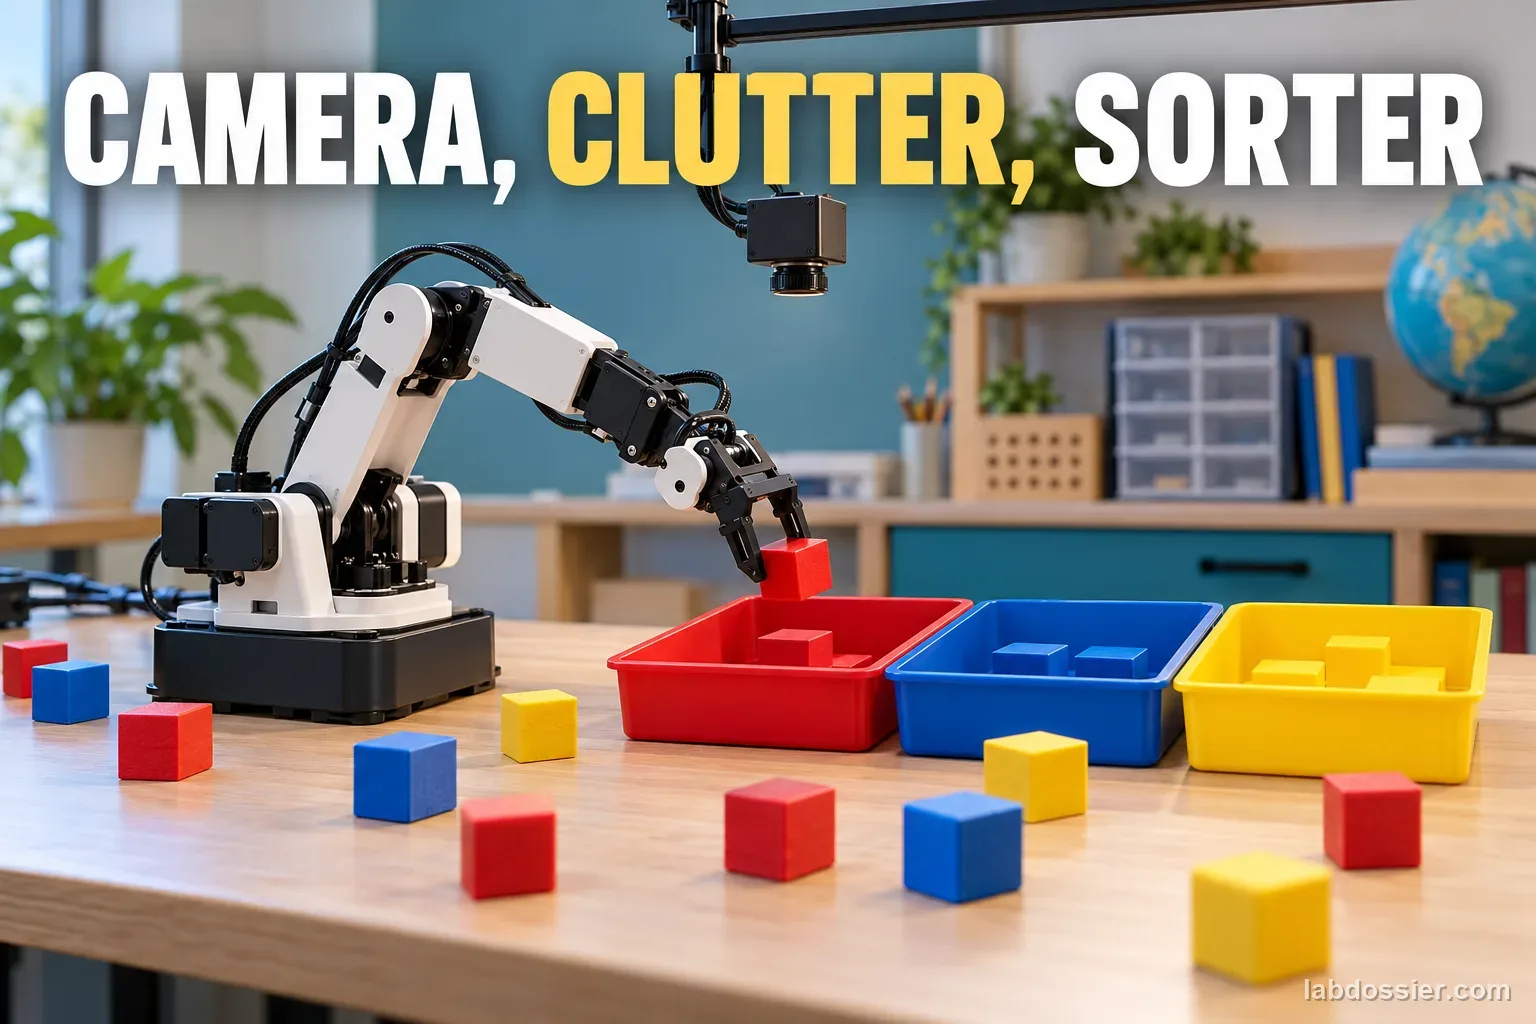
How do clutter and lighting affect camera-based robot sorting?
Compare a fixed camera robot's sorting in sparse or crowded scenes at two measured, safe room-light levels. Keep the same objects and robot settings, repeat each of the four combinations, and classify detection, pickup, and placement failures separately.
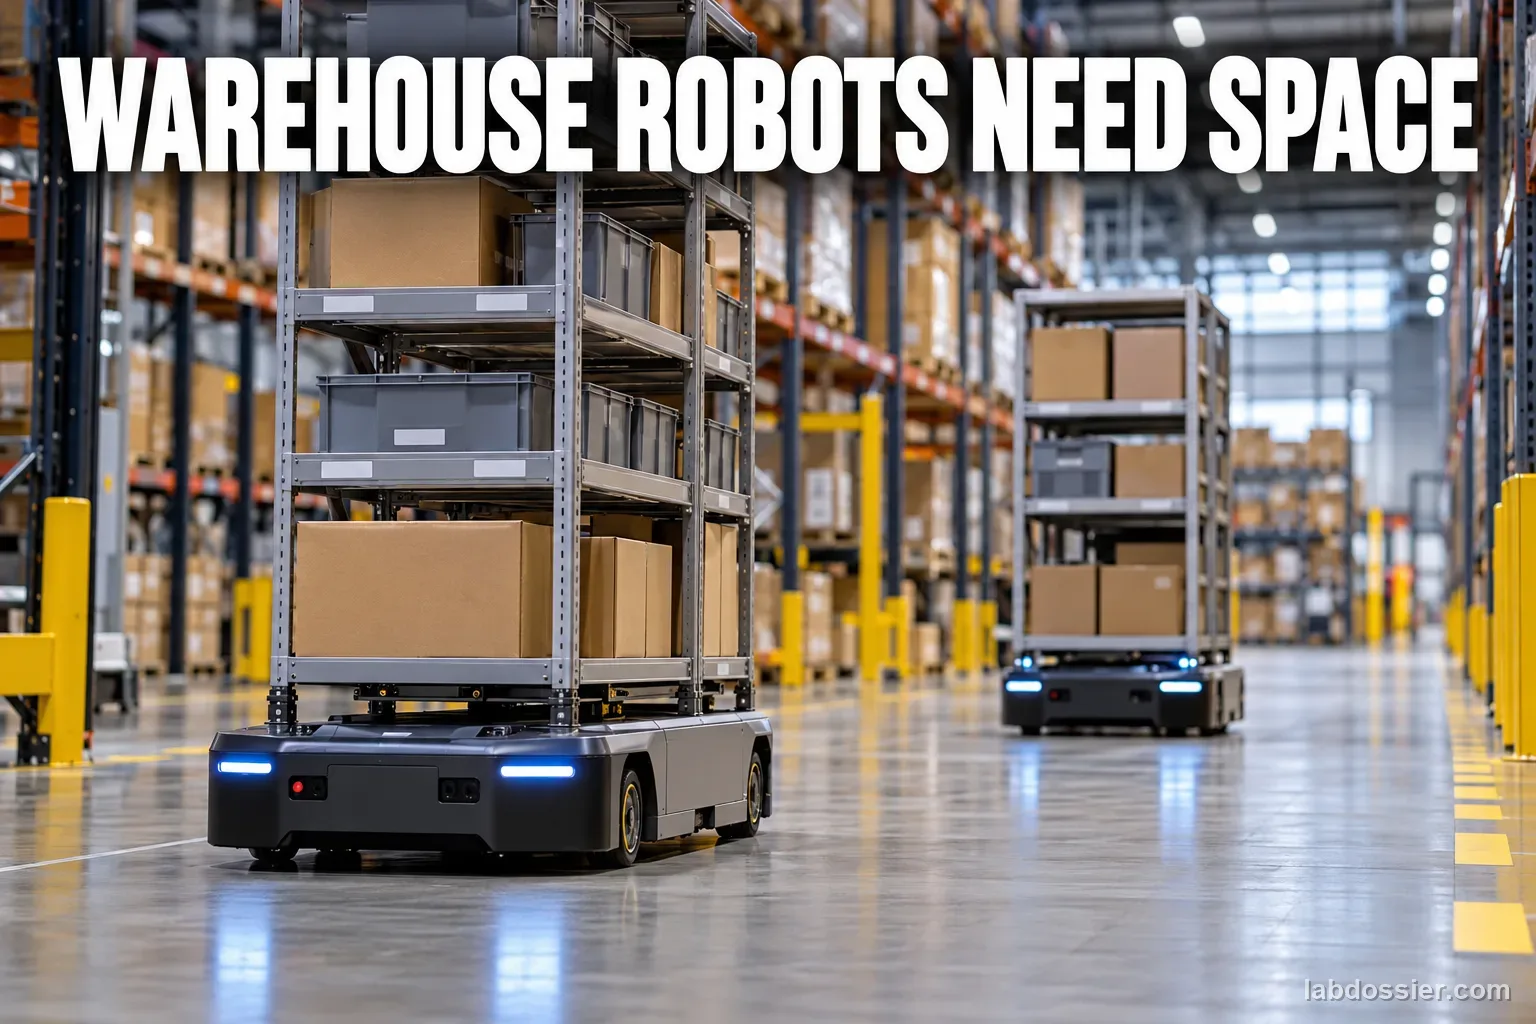
Which warehouse route layout reduces robot travel and waiting?
Use a small graph-paper warehouse with three robot tokens to compare a single cross-aisle, a second cross-aisle, and one-way aisle directions. Reuse the same task cards for every layout and measure grid distance, waits, junction queues and completion time. This is a simplified model, not a warehouse safety or throughput test.
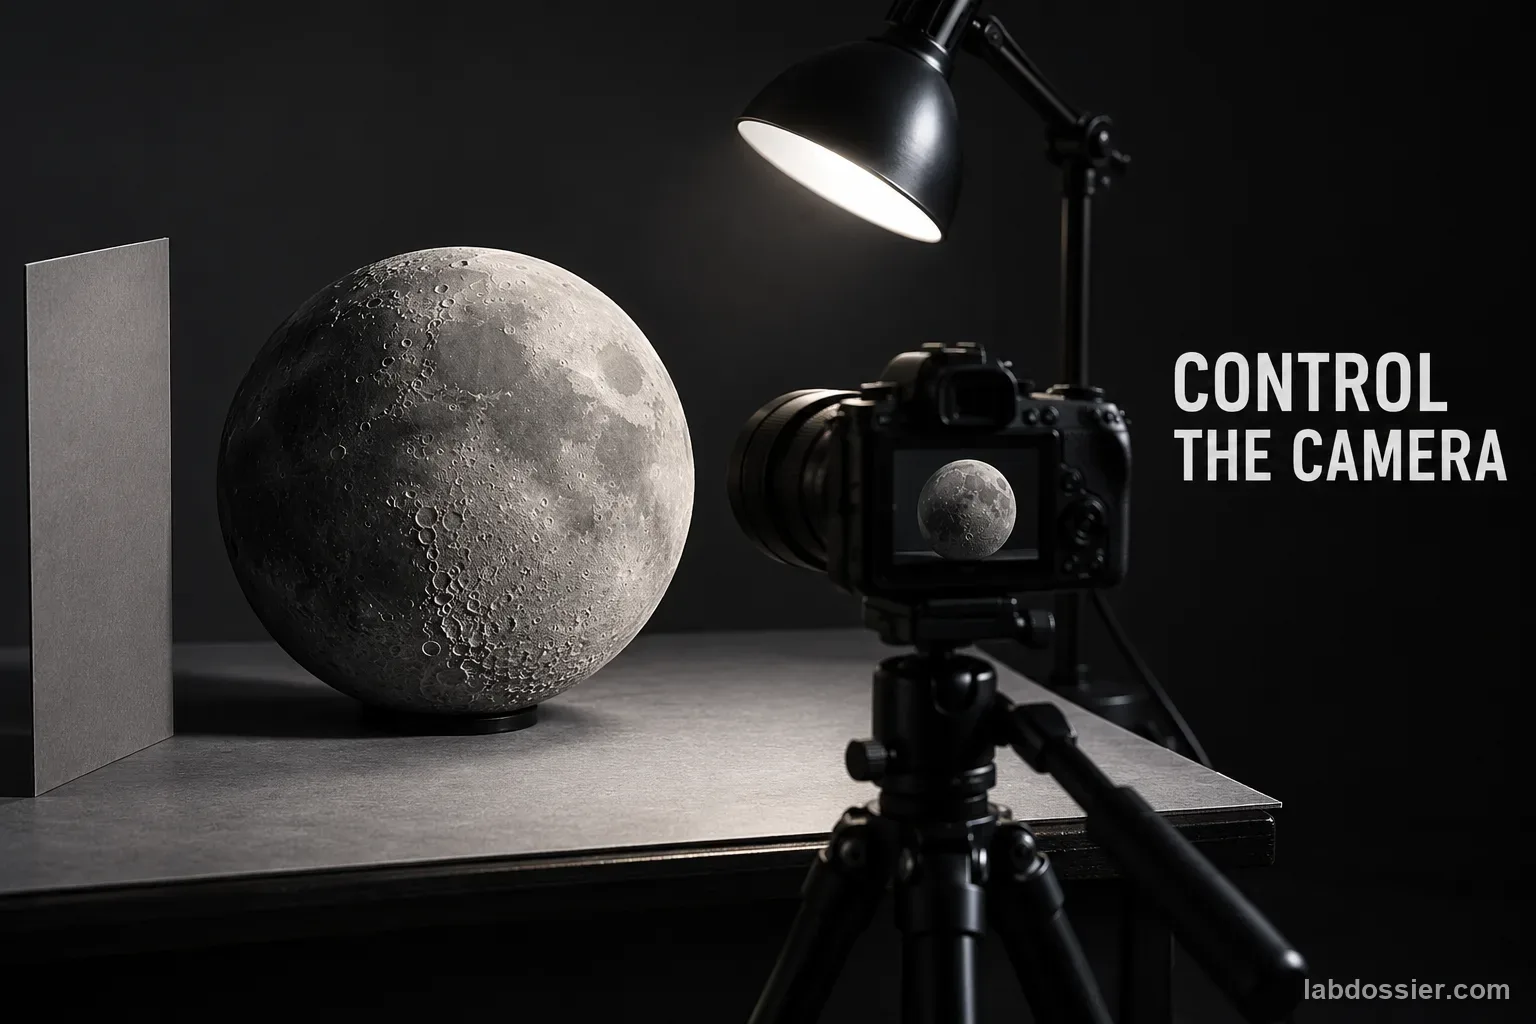
How do Artemis-era lunar observations distinguish surface brightness from camera exposure?
Photograph one fixed, crater-textured target at three manual shutter settings, then compare NASA lunar images taken under different Sun angles. Explain why displayed pixel brightness alone cannot reveal a surface's reflectance.
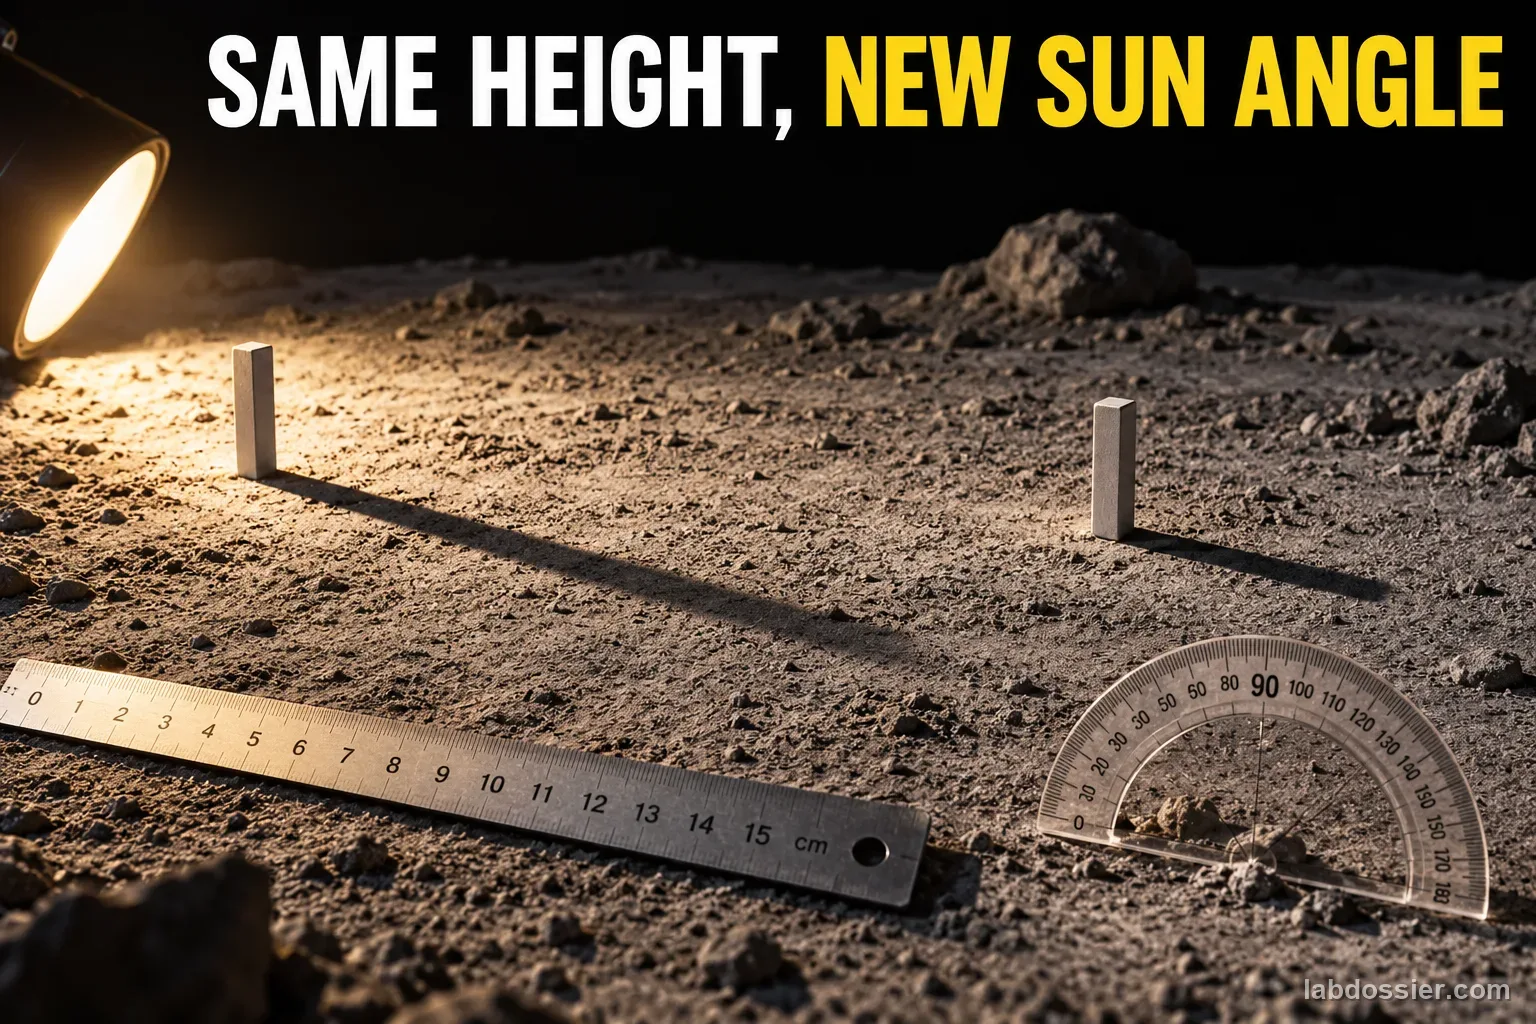
How does the Sun's angle change a Moon-surface shadow?
Hold a model object's height and ground level fixed while calculating its shadow at four Sun elevations. Compare the ideal relation with NASA's illumination maps and explain what a flat-surface model leaves out.
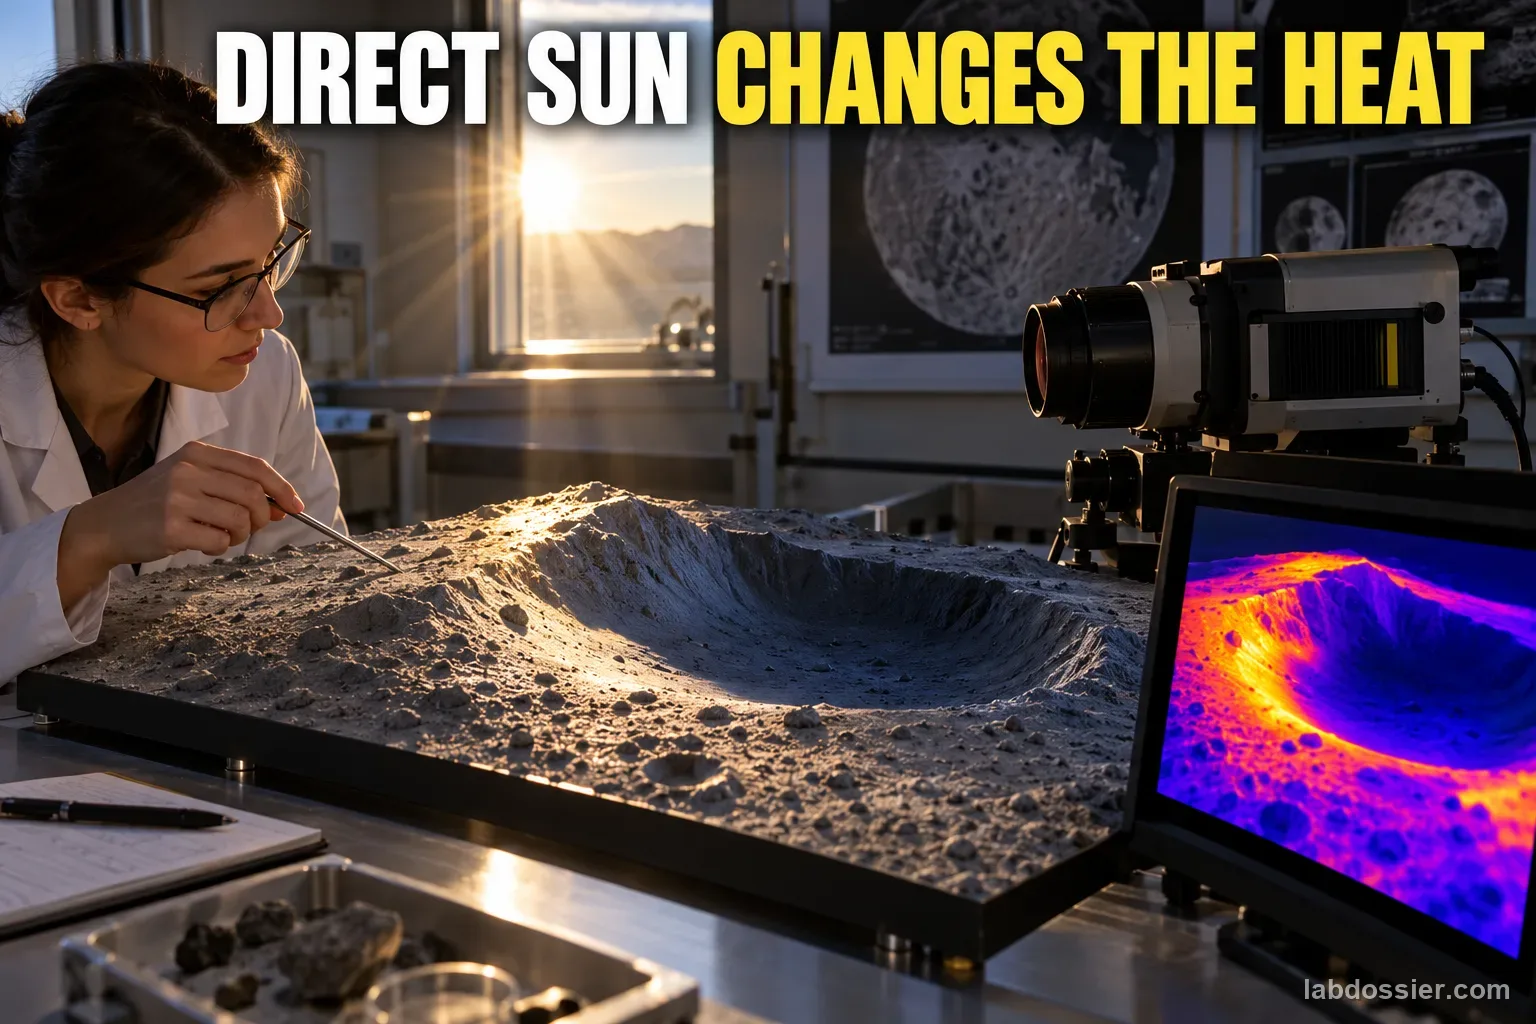
Why can permanently shadowed lunar terrain stay cold beside sunlit ridges?
Use a safe crater model to test how reflected visible light can reach a shaded floor. Then analyze NASA camera and thermal-model evidence to explain why being visible to a camera does not mean receiving enough energy to warm a lunar cold trap.
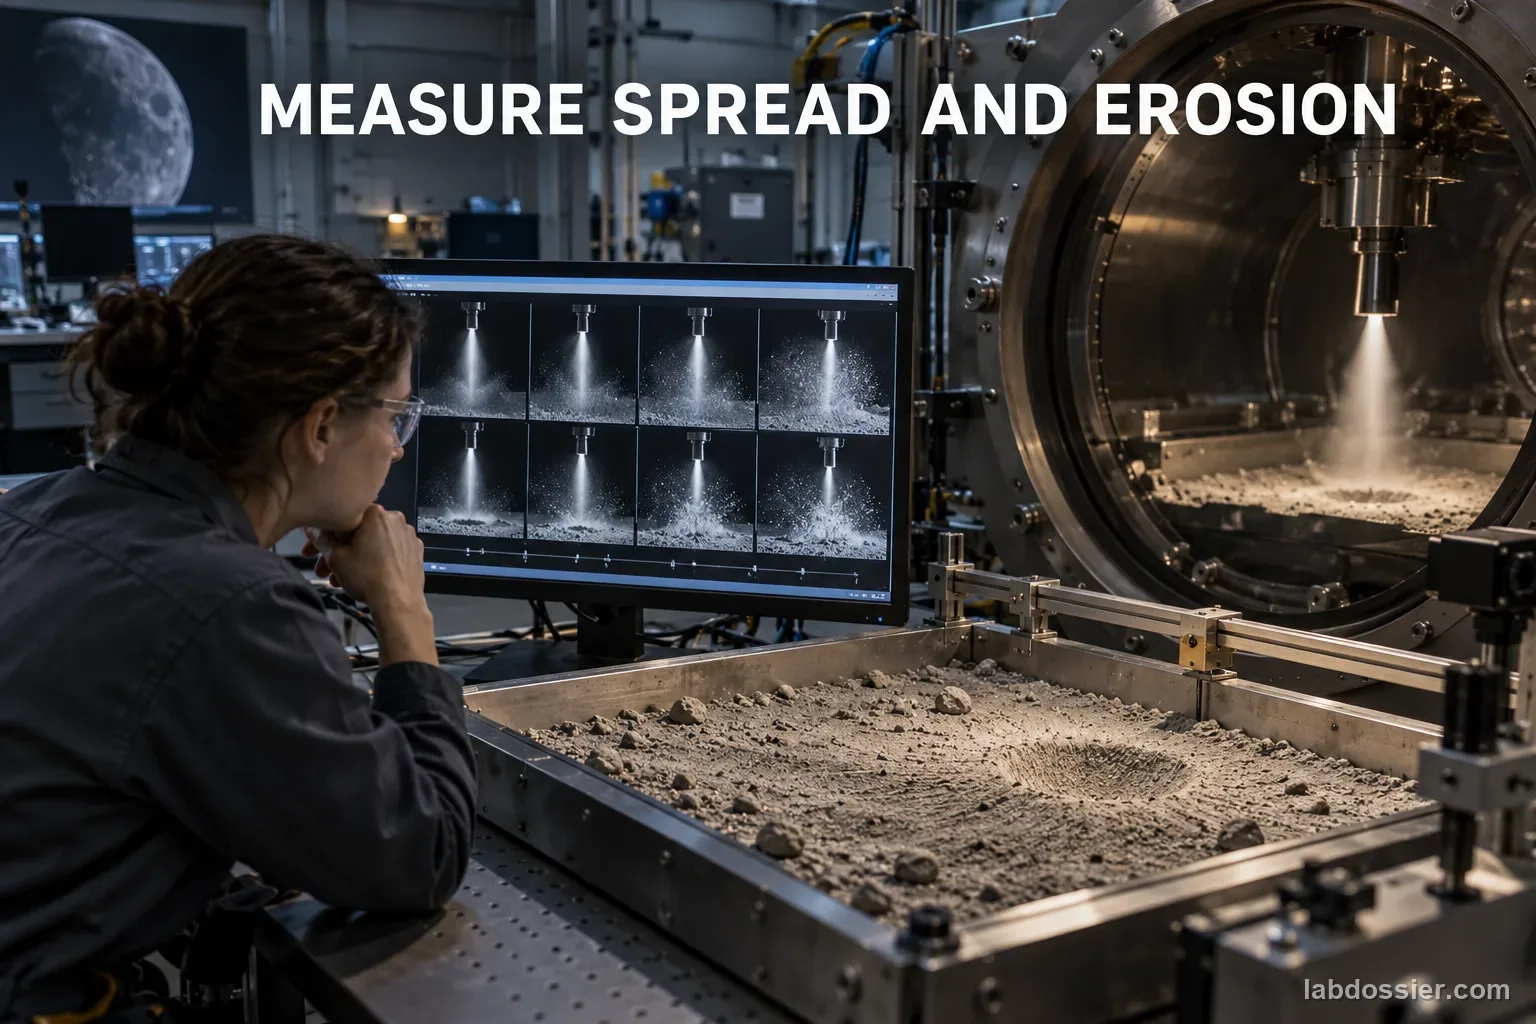
How can airflow move lunar-like ejecta, and where does a tabletop model stop matching the Moon?
Measure how a repeatable hand-generated air puff moves large paper pieces as nozzle height changes. Compare the safe classroom airflow model with NASA's vacuum-chamber tests and explain why it cannot predict a lunar landing plume.
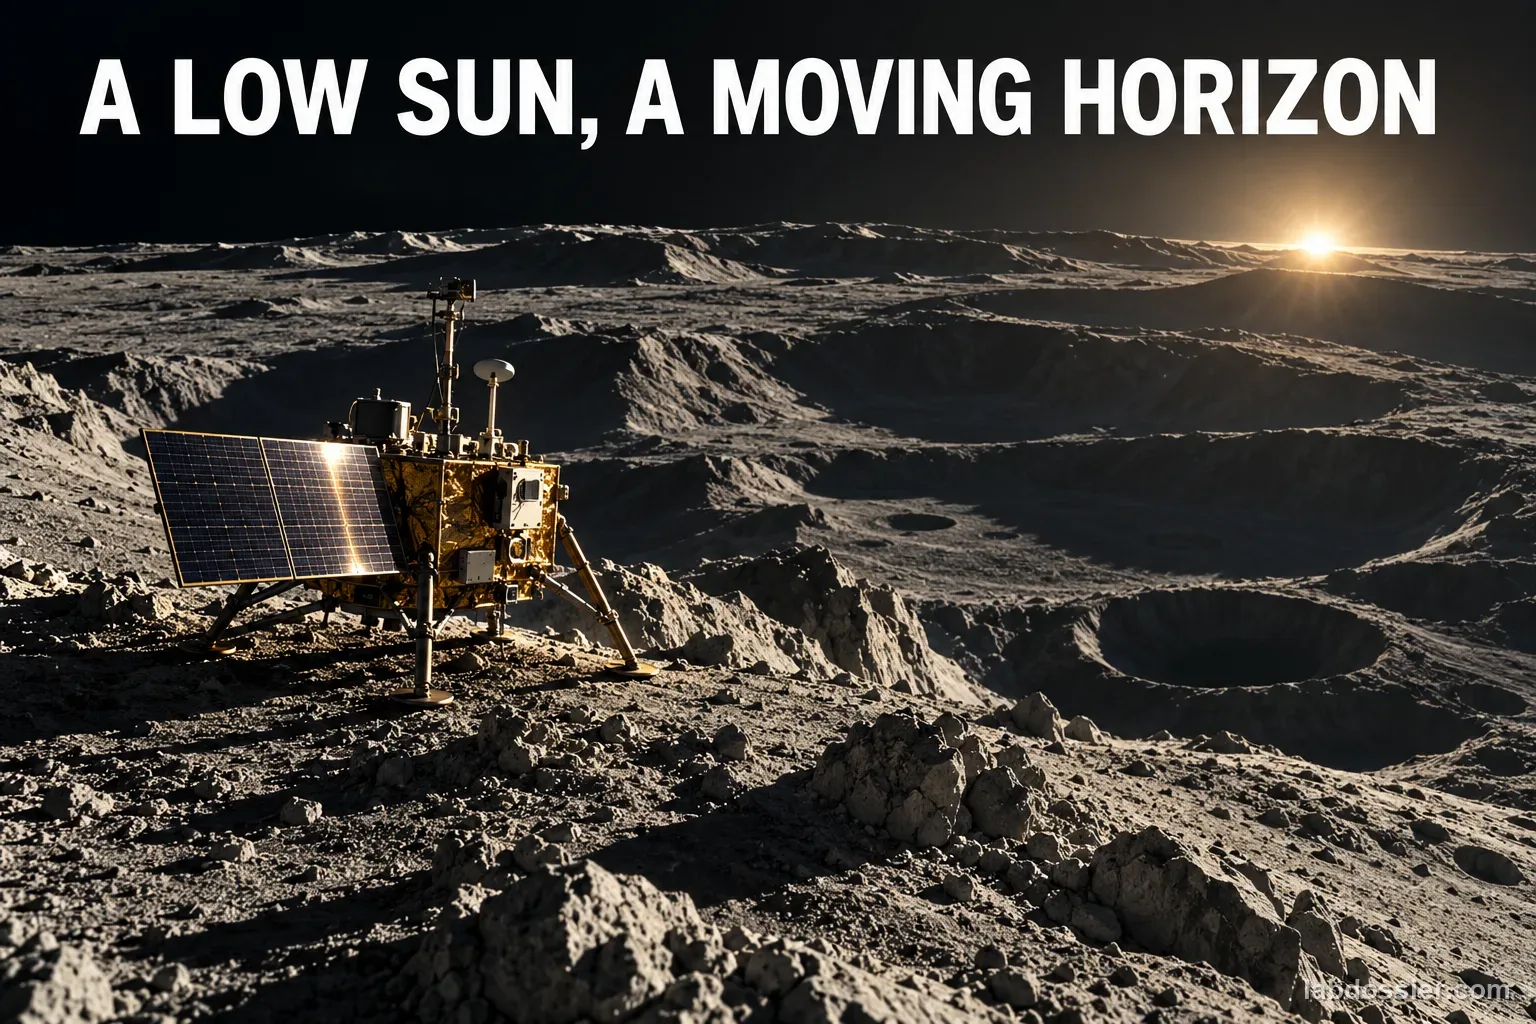
Which lunar ridge orientation can keep a lander in sunlight for the longest continuous interval?
Test how the orientation of one model ridge changes the longest continuous light interval at a marked lander site. Compare the small geometric model with NASA's LOLA illumination products and current south-pole site-selection constraints.
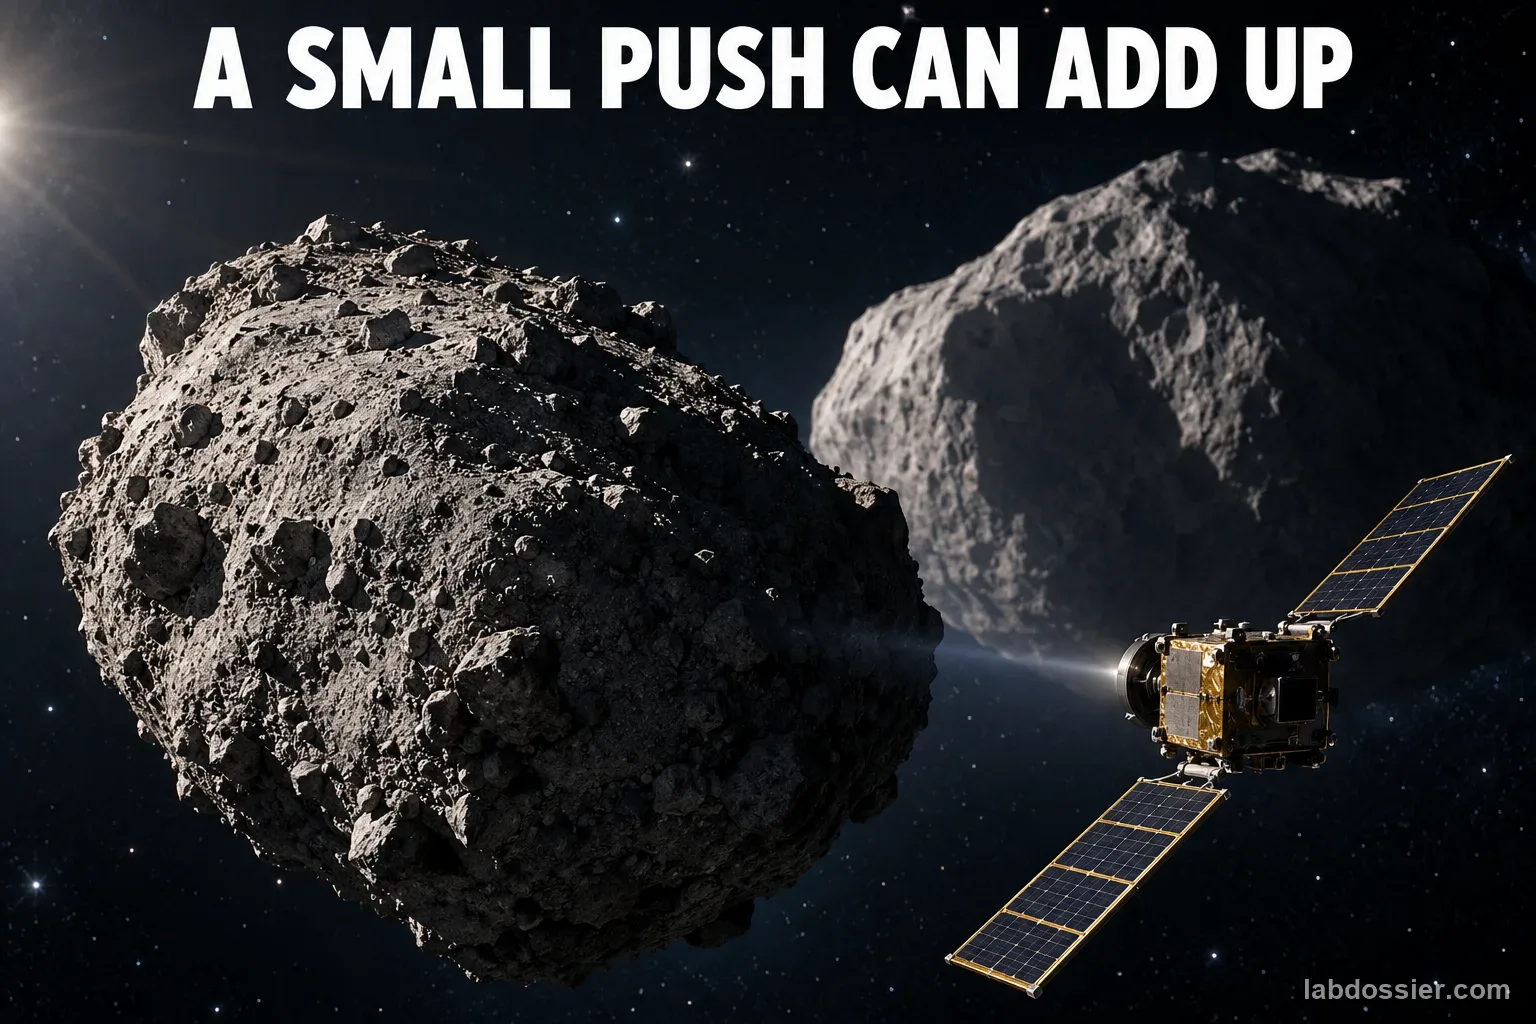
How can a small spacecraft change an asteroid's path through momentum transfer?
Vary one impactor cart's measured speed and compare the momentum transferred to a stationary target cart. Use DART and Hera sources to explain direct collision momentum, ejecta recoil, orbit measurements and why a classroom collision cannot forecast an asteroid deflection.
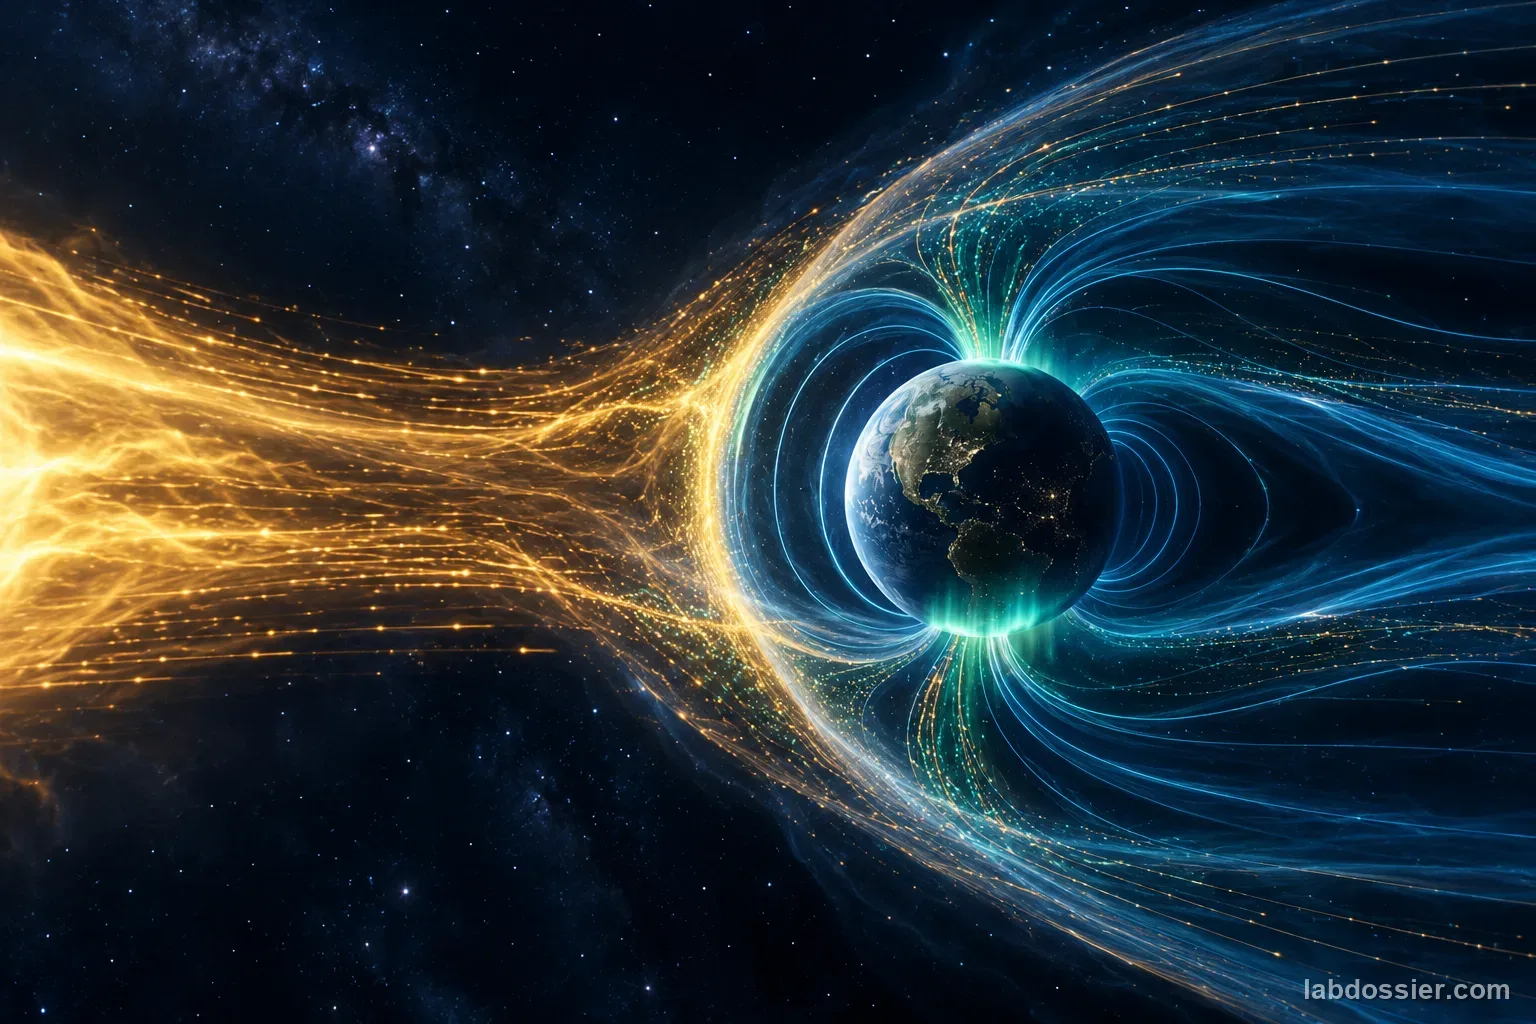
How does magnetic-field strength change the predicted force on an identical simulated charged particle?
Measure magnetic-field strength at controlled positions with a Hall sensor, then calculate relative magnetic-force-per-unit-charge-speed for an identical hypothetical particle moving perpendicular to each measured field. Compare this narrow model with NASA research on Earth's magnetosphere, reconnection and Mars' local crustal fields.
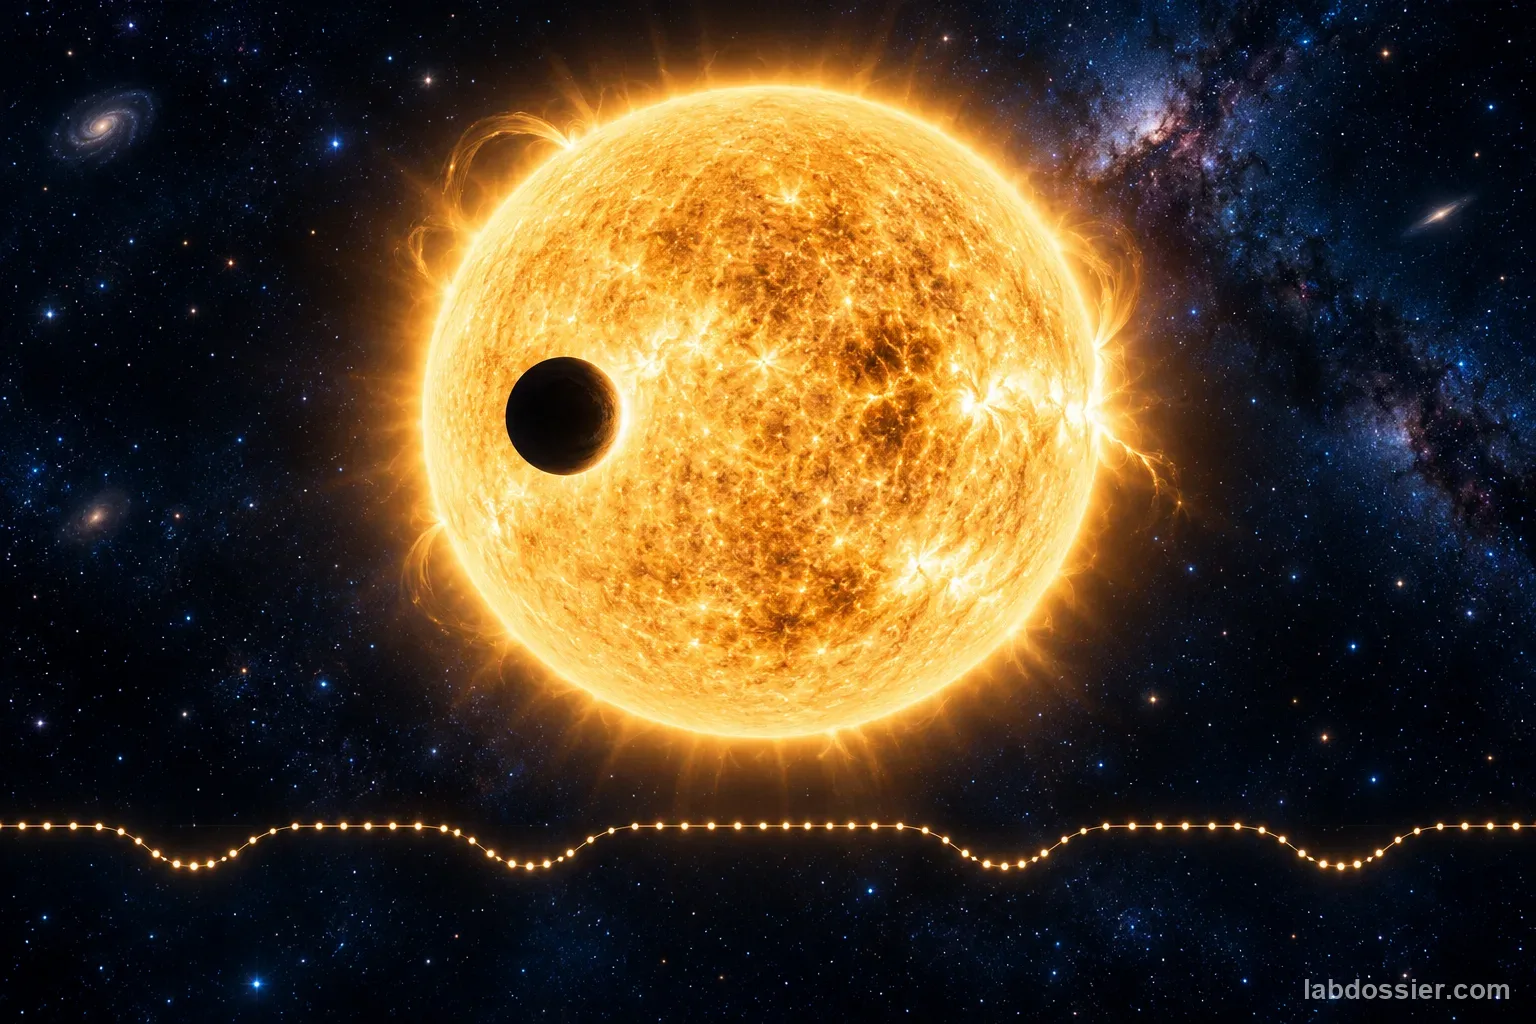
How can a repeating exoplanet transit be detected in a noisy light-curve dataset without mistaking it for proof of a planet?
Use a small synthetic light curve with three repeated shallow dips and realistic scatter. Fold the data at three trial periods, compare the mean depth and scatter around transit phase, and identify how instrumental trends, stellar variability, data gaps and eclipsing binaries limit a candidate claim.
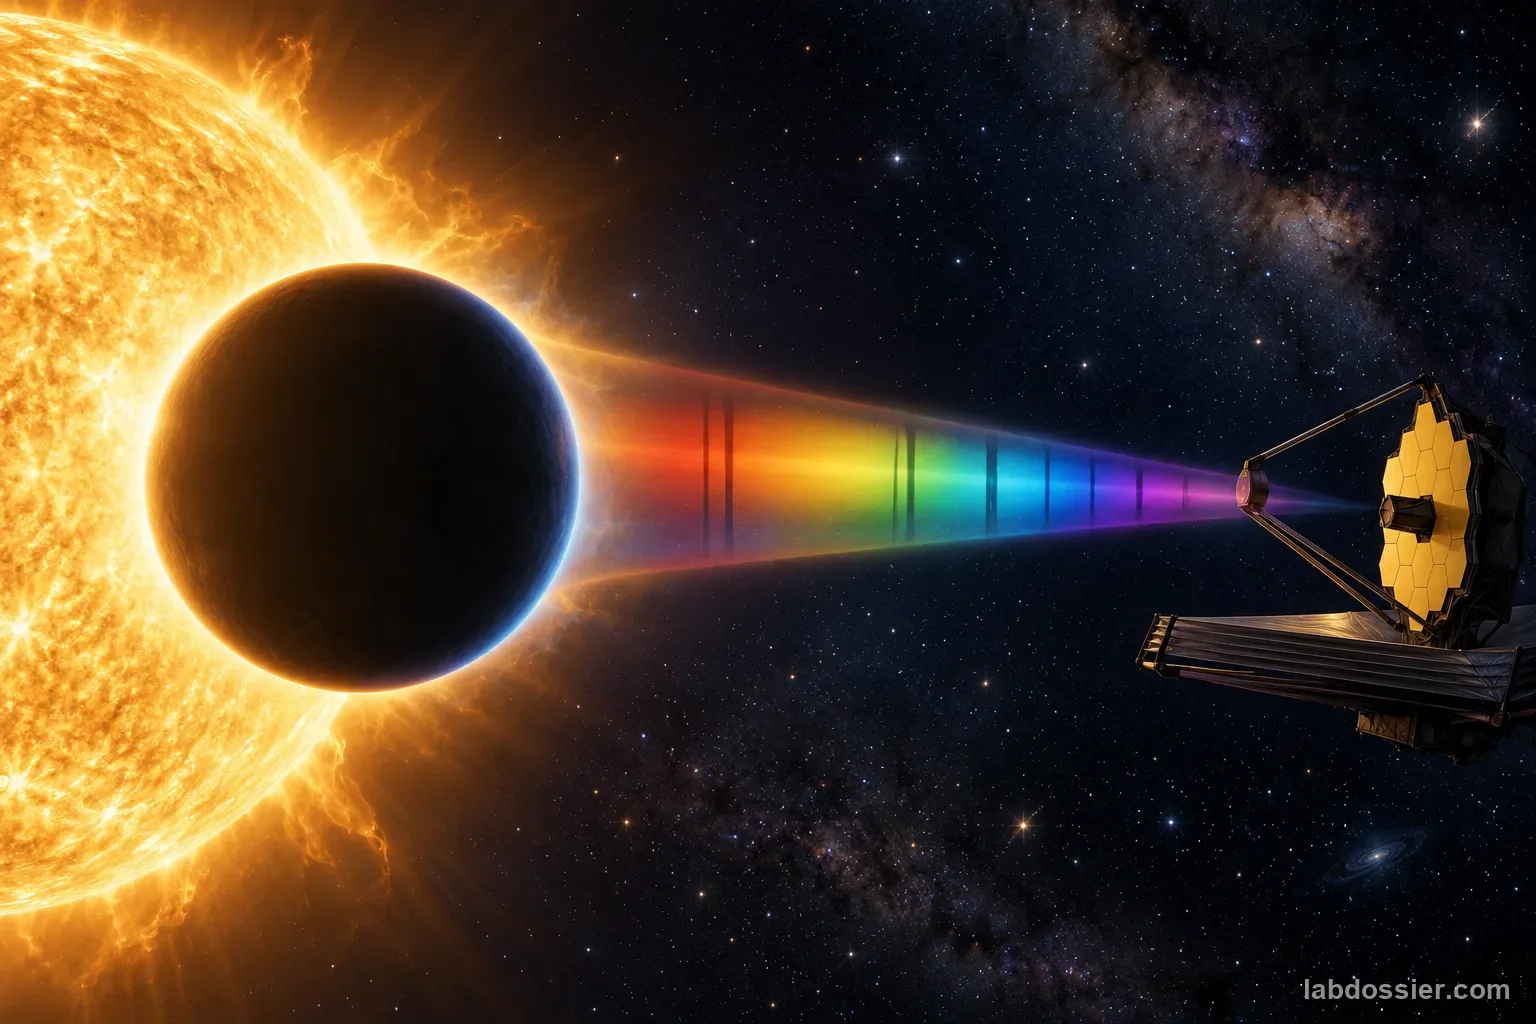
What can and cannot be inferred from a telescope's exoplanet spectrum?
Read clearly synthetic transmission-spectrum cases and compare them with current JWST results. Identify wavelength features supported by uncertainty ranges, then evaluate cloud/haze degeneracies, transit geometry, stellar contamination and the gap between detecting a molecule and inferring habitability or life.
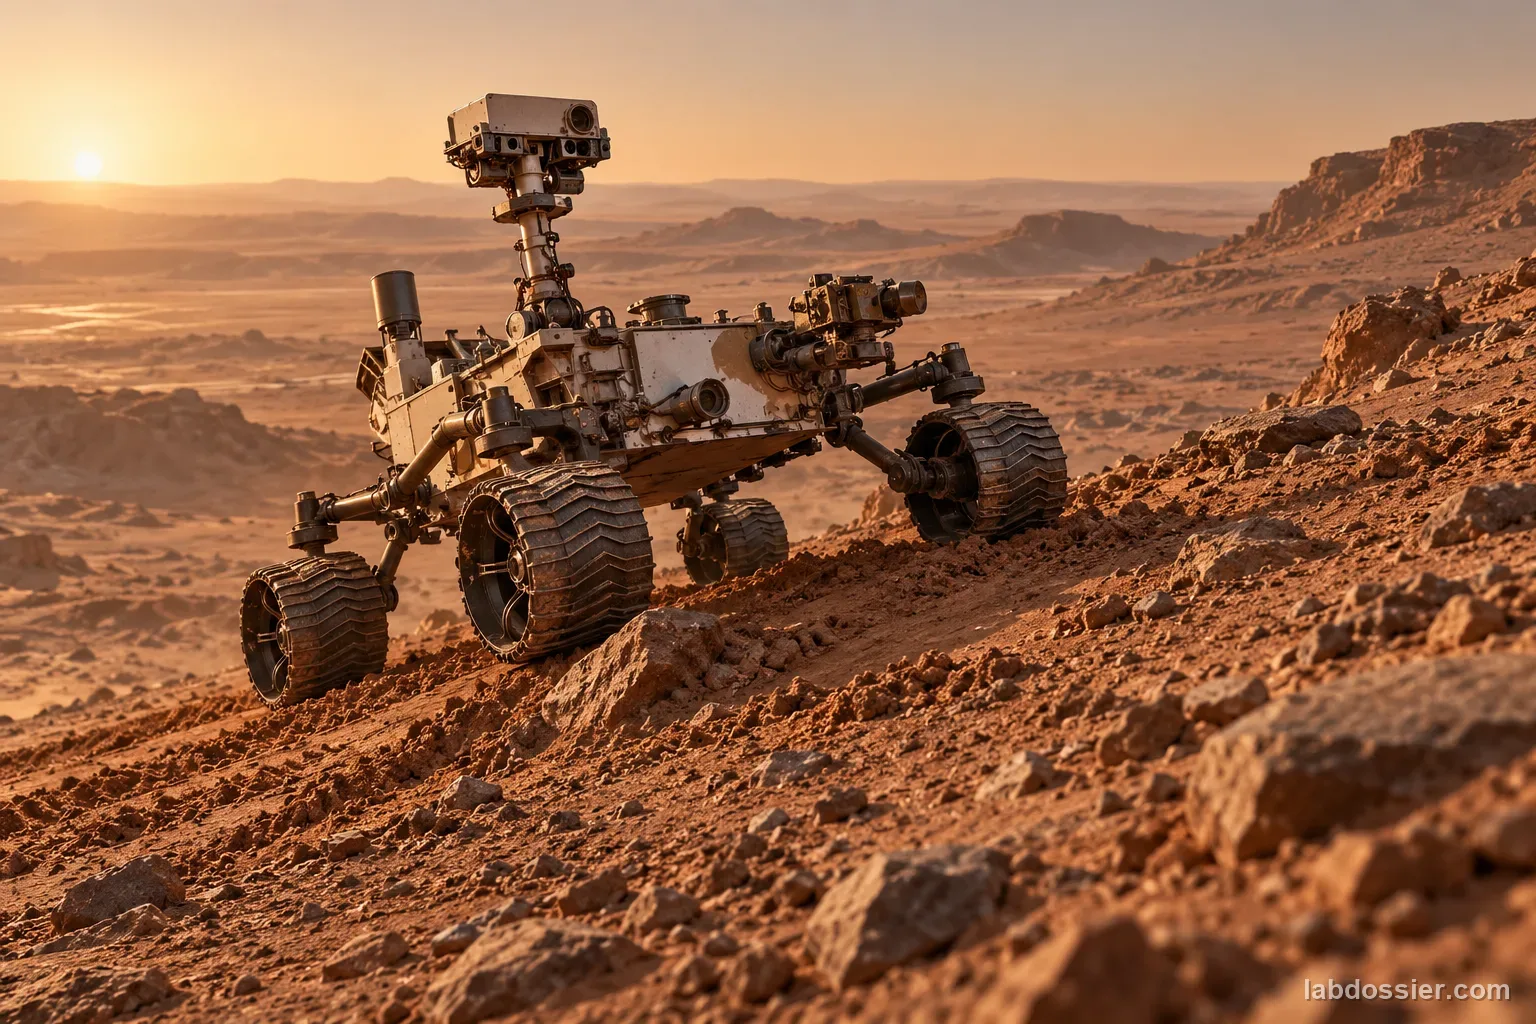
How does wheel tread change a rover model's slip and sinkage on a loose slope?
Use a small hand-cranked wheel test rig on a fixed low-angle ramp to compare matched smooth, four-rib and eight-rib tread patterns in a repeatably prepared sand bed. Measure distance traveled per three wheel rotations, calculate a bounded slip proxy, and record sinkage. Change slope only in a separate extension and compare with NASA rover testing and current terrain-adaptive research.