LF-21 · TEACHER LESSON PLAN
Plant growth and light lab
Compare three light environments with repeated seedling measurements
Driving question
Learning objectives
- Students measure the height of nine matched seedlings from soil line to tip on eight shared dates across three light environments.
- Students graph individual height traces and a treatment summary while keeping plant-to-plant spread visible.
- Students explain a pattern in height and day-14 leaves while distinguishing subsamples in one location from independent treatment replication.
Standards
| Dimension | Alignment |
|---|---|
| Performance expectation | MS-LS1-5Construct a scientific explanation based on evidence for how environmental and genetic factors influence the growth of organisms. (Partial alignment: students vary one environmental factor (light) for one kind of plant and cannot separate genetic factors; the assessment boundary excludes genetic mechanisms and biochemical processes.) |
| Practices | SEP 4Analyze and interpret data. |
| Core idea | LS1.BGenetic factors as well as local conditions affect the growth of the adult plant. |
| Crosscutting | Cause and effectCause and effect relationships are routinely identified, tested, and used to explain change. |
Standards text paraphrased from nextgenscience.org. Alignment is partial; this hands-on activity does not cover every part of the performance expectation. The CCC connection is conceptual: students identify an association between assigned light conditions and observed growth, while other causes may remain.
State standards crosswalk
Use the row as a planning crosswalk, then confirm local district pacing and grade placement. “Partial” labels describe a skill connection, not full mastery of the complete standard.
| State | Verified standard | How this lesson aligns | Official source |
|---|---|---|---|
| California | CA NGSS MS-LS1-5 | Partial. Students use evidence to explain how light as one local condition relates to growth, but the plan does not compare genetic factors or multiple plant varieties. | Open standard ↗ |
| Texas | Science.7.1(B) | Practice connection. Students plan and conduct a comparative investigation; this expectation is a science practice, not a plant-growth content standard. | Open standard ↗ |
| Florida | SC.7.L.17.3 | Limited. The activity tests light with seedlings but does not investigate ecosystem limiting factors or effects on native populations. | Open standard ↗ |
| New York | MS-LS1-5 | Partial. Students use repeated height and leaf observations to explain a light-related pattern, but do not test genetic differences. | Open standard ↗ |
| Pennsylvania | 3.1.6-8.E | Partial. The light comparison addresses an environmental factor with evidence; the activity does not address genetic factors or multiple varieties. | Open standard ↗ |
Materials and prep timeline
PER GROUP
- 9 matched, pre-started bean seedlings from one seed batch (3 per condition)
- 9 matching pots with 250 mL equal potting soil each
- Labels for three dark, three partial-light and three brighter-light seedlings
- Ruler marked in millimeters or centimeters
- Water measure and observation log for 8 check-ins
- Thermometer if available; tray
TEACHER ONLY
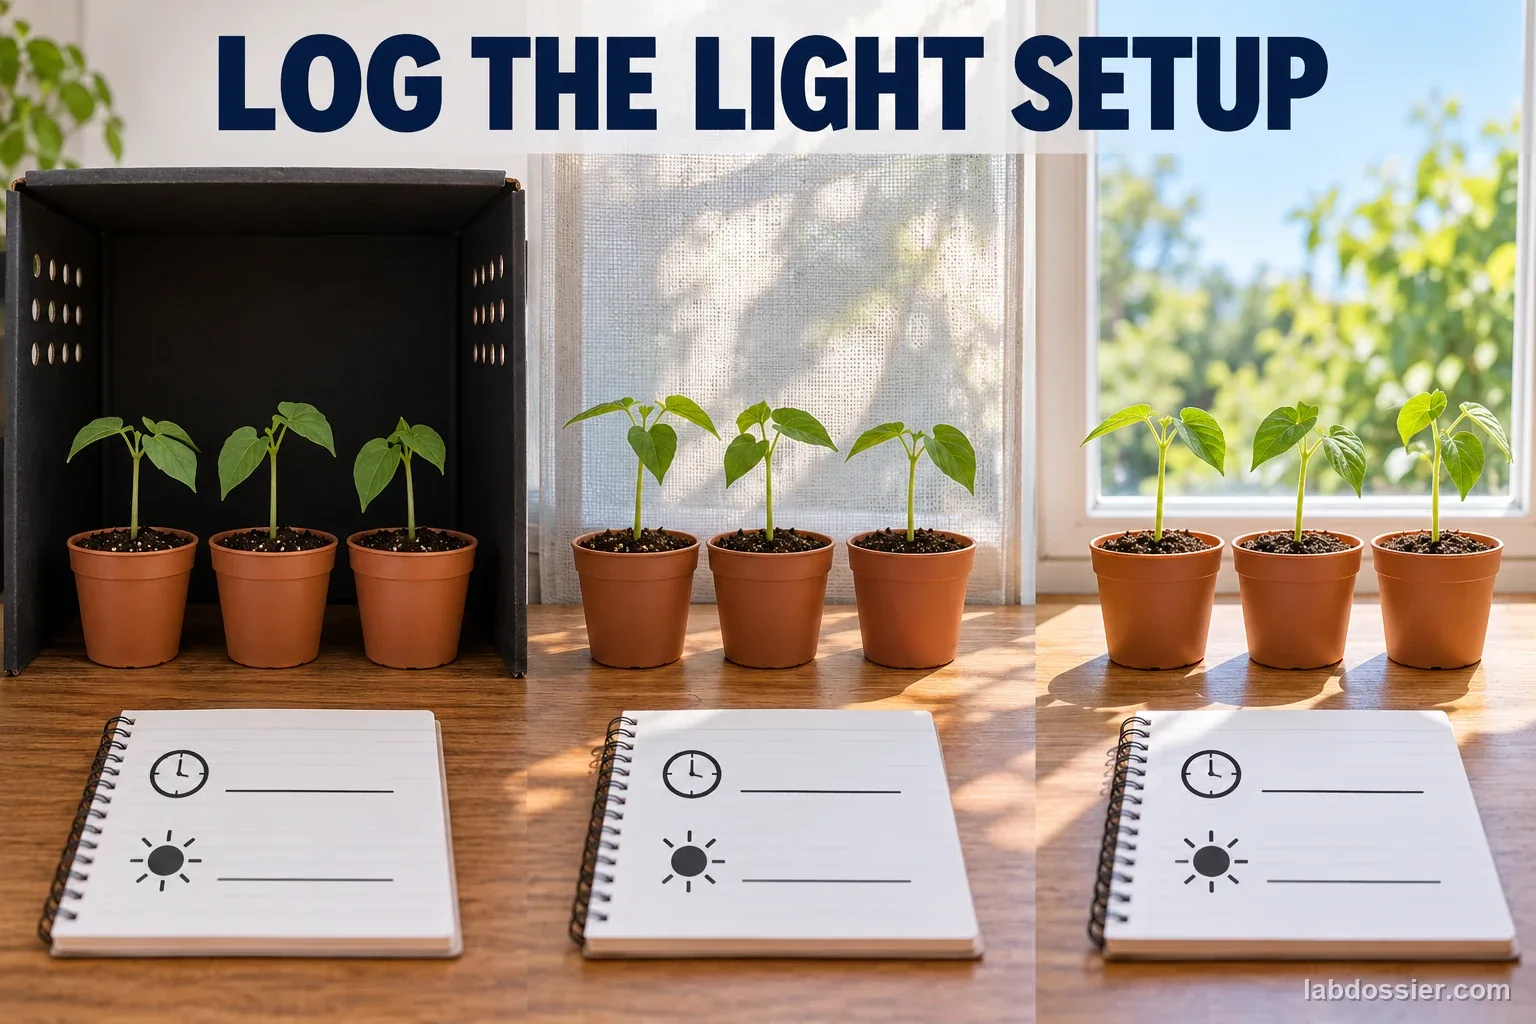
- Prepare one dark but ventilated location (~0 h), one partial-light schedule (about 4–6 h/day), and one brighter-light schedule (about 8+ h/day); log actual hours, brightness description and temperature.
- Keep temperature as similar as practical and check all pots for water at the same time. Three seedlings in one location are subsamples, not independent treatment replicates.
- If using a lamp, secure a cool-running lamp away from water and plugs; provide one student sheet per student.
CLASS-SIZE KIT PLANNER
One per-group kit contains every item in the team materials list above. Groups are balanced around the listed 3–4 students target.
| Students | Groups | Per-group kits | Student sheets | Suggested group split |
|---|---|---|---|---|
| 20 | 6 | 6 complete kits | 20 copies | 2 groups of 4 and 4 groups of 3 |
| 25 | 7 | 7 complete kits | 25 copies | 4 groups of 4 and 3 groups of 3 |
| 30 | 8 | 8 complete kits | 30 copies | 6 groups of 4 and 2 groups of 3 |
Choose similar seedlings from one seed batch, label each light condition, measure starting height and record the actual daily light schedule.
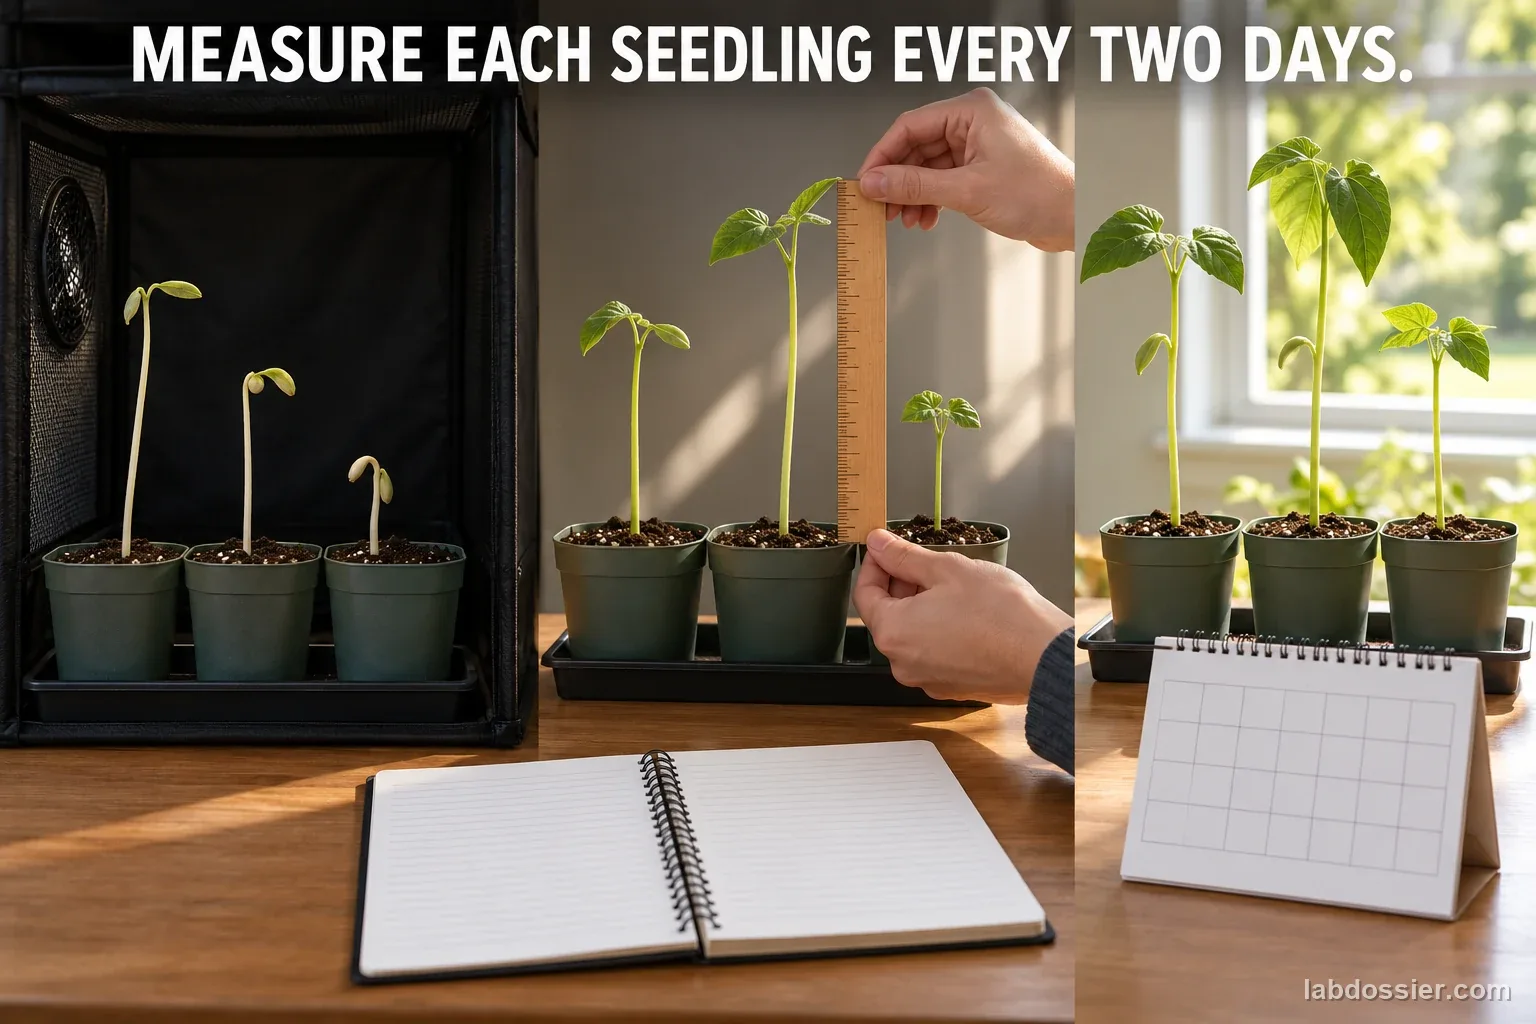
At the same time of day, record each soil-to-tip height and note color or leaning. Water equally as needed and log changes.
Measure all nine plants, count each plant's leaves, make a labeled biological drawing of a representative seedling from each environment, graph individual trends, and summarize each environment with a mean and range.
Lab figures and data visuals
Reviewed article images support the lesson flow. Use the tables and student sheet to record actual observations; pictured patterns are not target results.
Printable shopping list
Shopping and staging checklist
Multiply the per-group kit contents by the class-size planner. The teacher section includes teacher-provided materials and setup or safety notes.
PER-GROUP KITS
- 9 matched, pre-started bean seedlings from one seed batch (3 per condition)
- 9 matching pots with 250 mL equal potting soil each
- Labels for three dark, three partial-light and three brighter-light seedlings
- Ruler marked in millimeters or centimeters
- Water measure and observation log for 8 check-ins
- Thermometer if available; tray
TEACHER-PROVIDED MATERIALS + SETUP RULES
- Prepare one dark but ventilated location (~0 h), one partial-light schedule (about 4–6 h/day), and one brighter-light schedule (about 8+ h/day); log actual hours, brightness description and temperature.
- Keep temperature as similar as practical and check all pots for water at the same time. Three seedlings in one location are subsamples, not independent treatment replicates.
- If using a lamp, secure a cool-running lamp away from water and plugs; provide one student sheet per student.
QUANTITIES BY CLASS SIZE
| Material | Per group kit | 20 students | 25 students | 30 students |
|---|---|---|---|---|
| Matched bean seedlings, three per light environment | 9 seedlings | 54 seedlings | 63 seedlings | 72 seedlings |
| Matching pots and labels | 9 pots + 9 labels | 54 + 54 | 63 + 63 | 72 + 72 |
| Potting soil, equal fill | 2.25 L total | 13.5 L | 15.75 L | 18 L |
| Rulers, water measures, and trays | 1 of each | 6 of each | 7 of each | 8 of each |
| Student observation sheets | 1 per student | 20 copies | 25 copies | 30 copies |
Prepare 6 kits for 20 · 7 kits for 25 · 8 kits for 30 students.
Lesson flow
| Minutes | What happens |
|---|---|
| Day 0 · 0–5 | Engage Predict how light exposure could relate to growth, while distinguishing height from overall health. |
| Day 0 · 5–15 | Explore Assign three matched seedlings to each of three environments: dark, partial (about 4–6 hours) and brighter (about 8+ hours). Log actual hours, observed brightness, temperature and starting heights. |
| Days 2–12 | Measure all nine plants from soil line to tip at the same time every two days. Note color and leaning; keep soil, pots and watering matched. |
| Day 14 · 0–8 | Explain Plot individual height lines across all check-in days. Summarize Day-14 height by environment with mean and range; count leaves separately and draw one representative plant with clear labeled lines and an arrow for known light direction. |
| Day 14 · 8–15 | Evaluate Compare final leaf counts and appearance with height. The three plants in one location are subsamples; independent treatment replication would require separate enclosures per environment. |
Discussion questions
1. Why measure on the same days and at the same time?
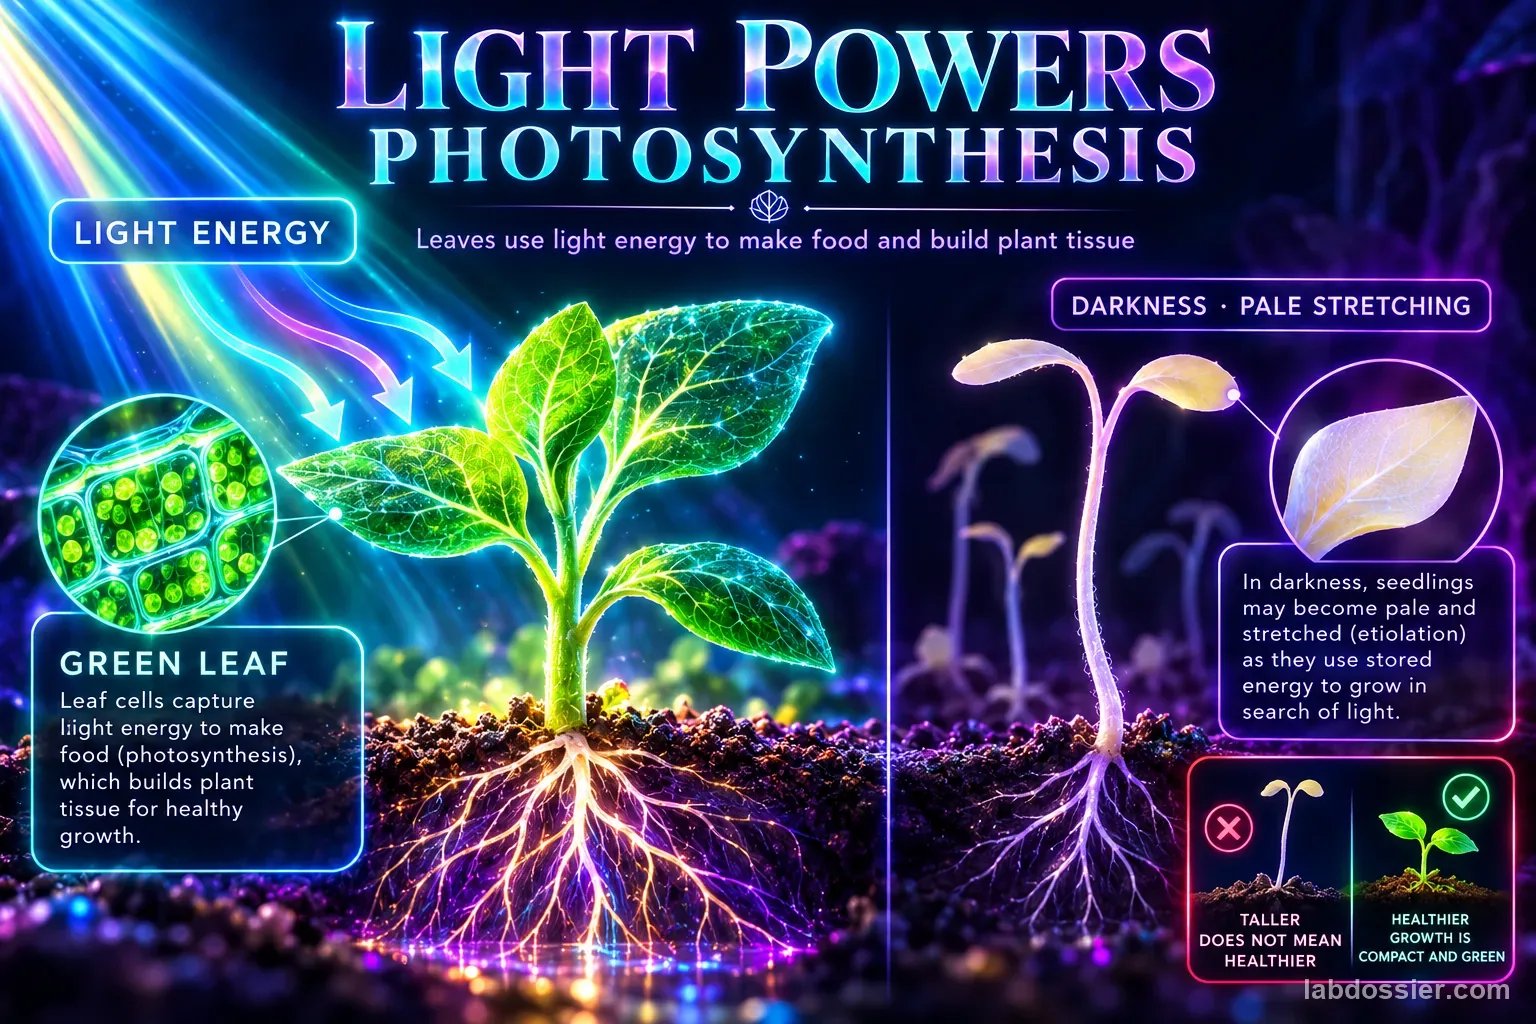
2. Does a taller seedling always mean it grew better?
3. What light conditions were actually compared?
4. What can this class investigation say about cause and effect?
Common misconceptions
Differentiation
SUPPORT
- Provide a calendar with check-in dates (Day 0, 2, 4, 6, 8, 10, 12 and 14) and assign a recorder for each check.
- Mark where the ruler begins at the soil line and show how to read millimeters before the first measurement.
- Offer frames: “From Day __ to Day __, the ___-light group changed from __ to __ cm.”
EXTEND
- Calculate average height change per day from Day 0 to Day 14, then compare it with the line graph.
- Run more seedlings per condition and graph each plant alongside its group mean to show variation.
- Plan a follow-up that measures light intensity while keeping temperature and water as similar as possible.
Assessment rubric
| Criterion | Beginning | Developing | Secure |
|---|---|---|---|
| Consistent measurement | Measurements omit dates or use different starting points. | Most heights use the soil line but one or more check-ins are missing. | Records soil-to-tip height on the shared two-day schedule with units. |
| Time-series graph | Does not graph height against time. | Graphs some days but omits a condition or mislabels an axis. | Shows each light condition across check-in days with day and height axes labeled. |
| Pattern and evidence | Claims a result without using recorded data. | Uses a final value but overlooks the trend or observations. | Compares time trends and supports a statement with measurements plus leaves, color or posture. |
| Limits | Says height proves health or light is the only cause. | Names one limitation without connecting it to the conclusion. | Explains that height is not health and mentions genetics or local conditions such as temperature/light variation. |
Vocabulary
- Seedling – A young plant that has recently sprouted.
- Environmental factor – A condition around an organism, such as light, water or temperature.
- Time series – Measurements of the same kind collected at multiple times.
- Growth rate – Change in a measurement divided by the time over which it changed.
- Control variable – A condition kept as similar as practical while testing a planned factor.
- Trend – A general pattern across measurements, which may include pauses or variation.
Safety, cleanup and troubleshooting
BEFORE STUDENTS TOUCH ANYTHING
- If using a lamp, have an adult place it securely and keep water, damp soil, and hands away from plugs and electrical connections. Use a cool-running light and allow it to cool before moving.
- Wash hands after handling potting mix or seedlings, and do not eat experimental plants.
Troubleshooting: If a seedling leans, record the direction and do not rotate only one pot. If a lamp warms one group, increase distance or use a cooler light with adult help and record the change. Do not move wet pots near plugs.