LF-14 · TEACHER LESSON PLAN
Potato osmosis lab
How potato-strip mass may change across different salt concentrations
Driving question
Learning objectives
- Students plan a fair comparison of three matched potato strips in each of 0%, 5% and 10% salt solutions, controlling potato source, strip dimensions, solution volume per strip, temperature and soak time.
- Students measure starting and final mass for nine strips to 0.1 g, calculate each mass and percentage change, and compare replicate means and ranges.
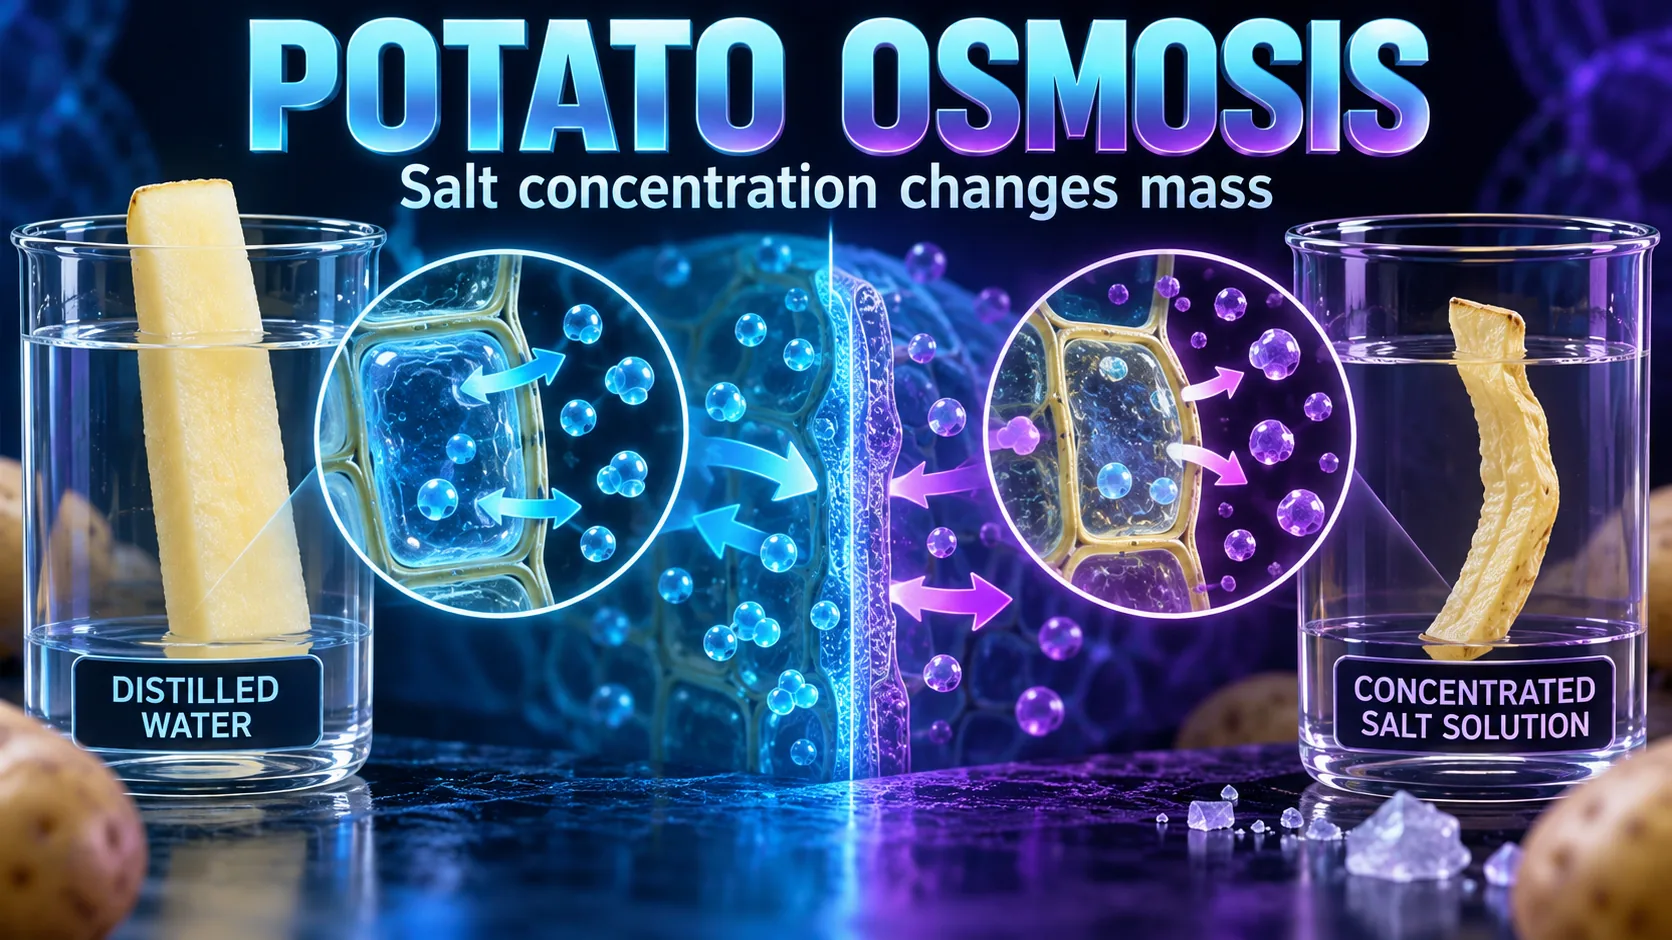
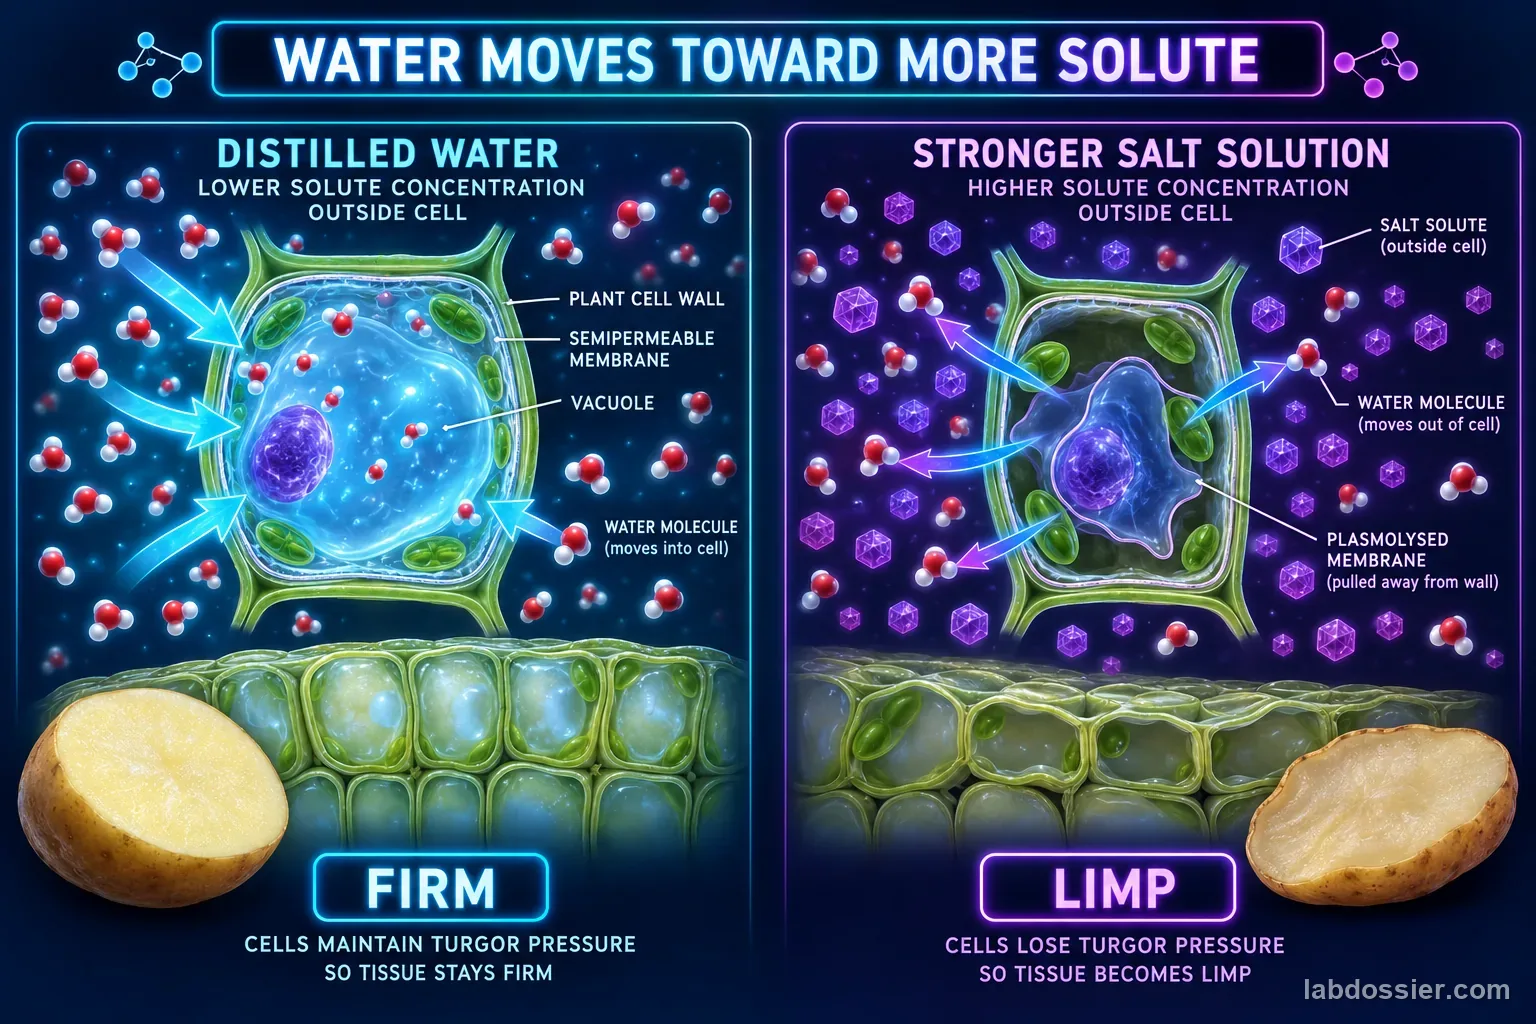
- Students explain how water movement across cell membranes can cause potato tissue to gain or lose mass in solutions of different concentrations.
Standards
| Dimension | Alignment |
|---|---|
| Performance expectation | HS-LS1-2Develop and use a model to illustrate the hierarchical organization of interacting systems that provide specific functions within multicellular organisms. (Partial alignment: potato tissue can illustrate cells and water movement, but this short investigation does not develop a complete model of interacting systems that provide organism functions.) |
| Practices | SEP 3Plan and carry out investigations. SEP 4Analyze and interpret data. |
| Core idea | LS1.ASystems of specialized cells within organisms help them perform the essential functions of life. |
| Crosscutting | Systems and system modelsSystems may interact with other systems; they may have sub-systems and be a part of larger complex systems. |
Standards text paraphrased from nextgenscience.org. Alignment is partial; this hands-on activity does not cover every part of the performance expectation.
State standards crosswalk
Use the row as a planning crosswalk, then confirm local district pacing and grade placement. “Partial” labels describe a skill connection, not full mastery of the complete standard.
| State | Verified standard | How this lesson aligns | Official source |
|---|---|---|---|
| California | CA NGSS HS-LS1-2 | Limited. Students discuss cells and water movement in potato tissue, but do not develop the required model of interacting organism systems. | Open standard ↗ |
| Texas | BIO.1(B) | Practice connection. Students plan and carry out an investigation; this Biology expectation is a scientific-practices standard, not a direct osmosis content match. | Open standard ↗ |
| Florida | SC.912.L.14.2 | Partial. The explanation connects cell membranes with passive transport, but students do not investigate membrane structure or active transport. | Open standard ↗ |
| New York | HS-LS1-2 | Limited. Potato mass change supports a cell-level discussion, but the lesson does not model interacting systems that provide organism functions. | Open standard ↗ |
| Pennsylvania | 3.1.9-12.B | Limited. The lesson refers to cells within tissue but does not develop a model of hierarchical interacting systems as required. | Open standard ↗ |
Materials and prep timeline
PER GROUP
- 9 matched potato strips cut to 5 cm × 1 cm × 1 cm
- Nine labeled replicate cups, each with 30 mL solution (three cups for each 0%, 5% and 10% condition)
- Prepare 100 mL final volume at each concentration, then divide evenly among its three cups
- Balance readable to 0.1 g
- 100 mL graduated cylinder, ruler, paper towels, tray and recording sheet
TEACHER ONLY
- An adult cuts strips on a stable cutting board with the knife directed away from hands, or provides pre-cut strips; use the same potato and cutter for comparable strips.
- For each group, prepare three 100 mL final-volume solutions: 0 g, 5 g or 10 g salt per 100 mL. These are weight-per-volume concentrations. Divide each solution among three labeled replicate cups (about 30 mL per cup, with a little spare), and put one matched strip in each cup. Cover and soak for 24 hours at room temperature. Do not eat the potato or solutions.
- Show safe balance use, handwashing and prompt cleanup of water and salt spills.
CLASS-SIZE KIT PLANNER
One per-group kit contains every item in the team materials list above. Groups are balanced around the listed 2–3 students target.
| Students | Groups | Per-group kits | Student sheets | Suggested group split |
|---|---|---|---|---|
| 20 | 7 | 7 complete kits | 20 copies | 6 groups of 3 and 1 group of 2 |
| 25 | 9 | 9 complete kits | 25 copies | 7 groups of 3 and 2 groups of 2 |
| 30 | 10 | 10 complete kits | 30 copies | 10 groups of 3 |
Introduce the question and predict how salt concentration may affect potato mass. Identify concentration as the changed variable, mass change as the measured outcome, and agree on strip size, solution volume and 24-hour soak. Review adult cutting and no-eating safety.
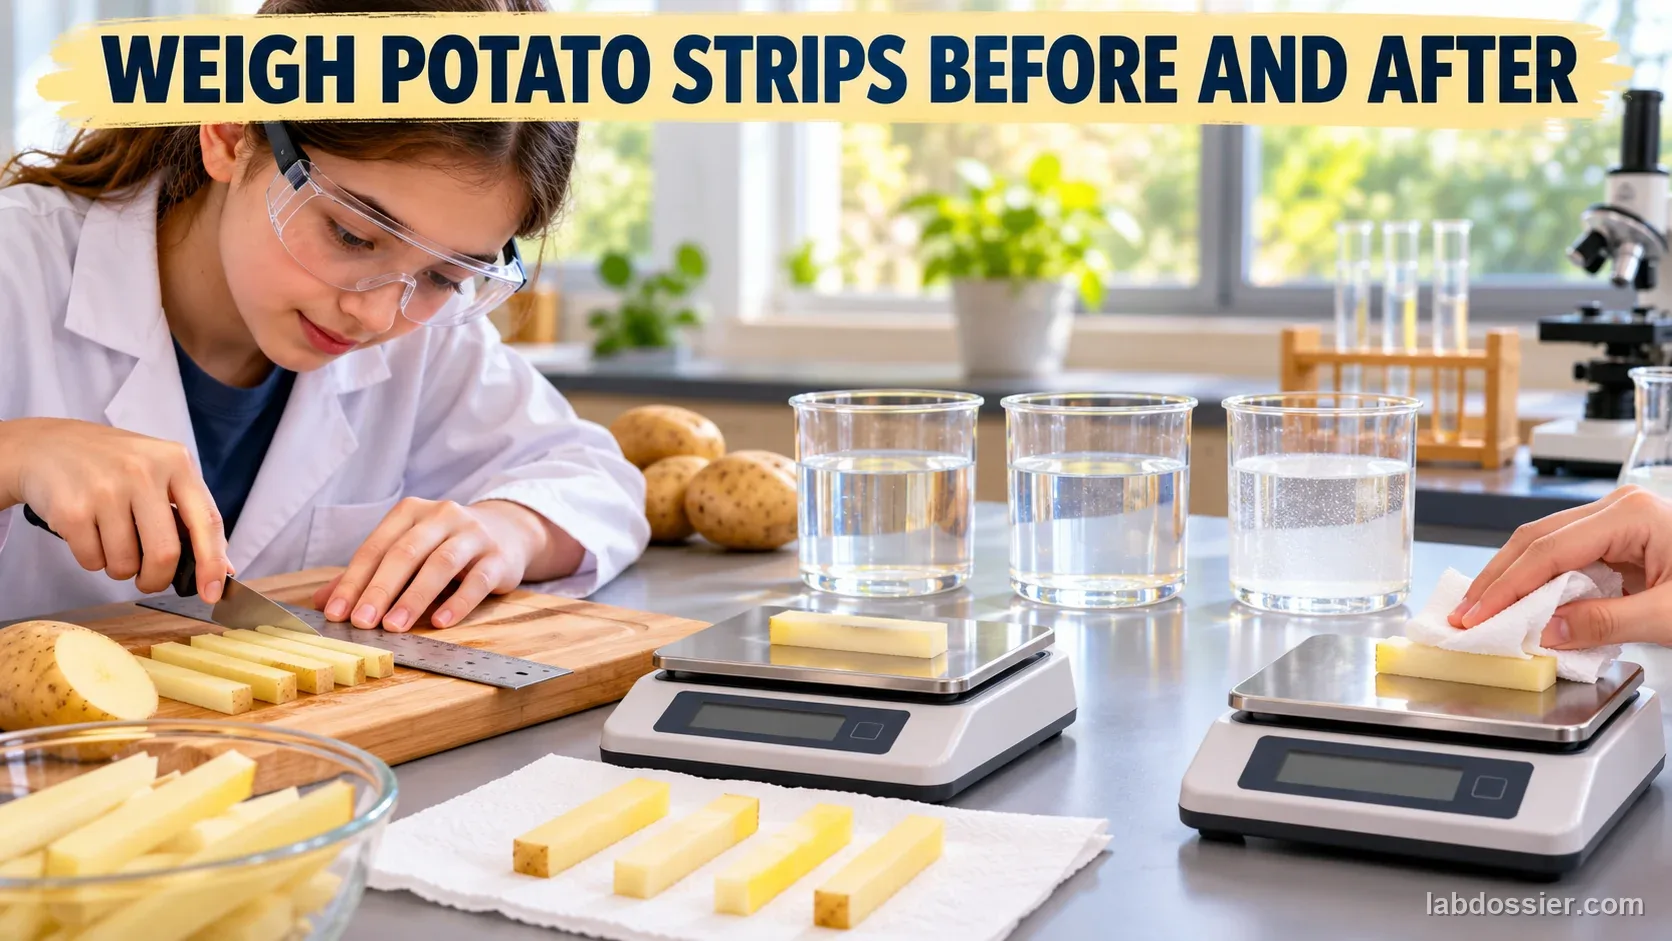
Prepare 100 mL final volume at each of 0%, 5% and 10% salt by weight per volume. Divide each solution among three cups (about 30 mL each), then record starting mass and length for nine matched strips and put one strip in each cup. Cover and leave at room temperature for 24 hours; soaking time is elapsed time, not class time.
Remove each of nine strips, blot with the same gentle method, then measure final mass to 0.1 g and final length. Record texture and appearance; wash hands and wipe spills.
Calculate final minus starting mass and percentage change for all nine strips. Compare the three replicate values, mean and range at each concentration. Use cell membranes and water potential to explain the measured pattern, and distinguish observations from a general conclusion.
Lab figures and data visuals
Reviewed article images support the lesson flow. Use the tables and student sheet to record actual observations; pictured patterns are not target results.
Printable shopping list
Shopping and staging checklist
Multiply the per-group kit contents by the class-size planner. The teacher section includes teacher-provided materials and setup or safety notes.
PER-GROUP KITS
- 9 matched potato strips cut to 5 cm × 1 cm × 1 cm
- Nine labeled replicate cups, each with 30 mL solution (three cups for each 0%, 5% and 10% condition)
- Prepare 100 mL final volume at each concentration, then divide evenly among its three cups
- Balance readable to 0.1 g
- 100 mL graduated cylinder, ruler, paper towels, tray and recording sheet
TEACHER-PROVIDED MATERIALS + SETUP RULES
- An adult cuts strips on a stable cutting board with the knife directed away from hands, or provides pre-cut strips; use the same potato and cutter for comparable strips.
- For each group, prepare three 100 mL final-volume solutions: 0 g, 5 g or 10 g salt per 100 mL. These are weight-per-volume concentrations. Divide each solution among three labeled replicate cups (about 30 mL per cup, with a little spare), and put one matched strip in each cup. Cover and soak for 24 hours at room temperature. Do not eat the potato or solutions.
- Show safe balance use, handwashing and prompt cleanup of water and salt spills.
QUANTITIES BY CLASS SIZE
| Material | Per group kit | 20 students | 25 students | 30 students |
|---|---|---|---|---|
| Large potato, one per group | 1 potato | 7 potatoes | 9 potatoes | 10 potatoes |
| Matched strips and labeled replicate cups | 9 strips + 9 cups | 63 + 63 | 81 + 81 | 90 + 90 |
| Three finished salt solutions | 300 mL total | 2.1 L | 2.7 L | 3 L |
| Salt for 5% and 10% weight-volume solutions | 15 g | 105 g | 135 g | 150 g |
| Balances readable to 0.1 g, graduated cylinders, rulers, trays | 1 of each | 7 of each | 9 of each | 10 of each |
| Student recording sheets | 1 per student | 20 copies | 25 copies | 30 copies |
Prepare 7 kits for 20 · 9 kits for 25 · 10 kits for 30 students.
Lesson flow
| Minutes | What happens |
|---|---|
| Day 1 setup (15 min) | Engage Predict how 0%, 5% and 10% salt solutions may affect potato mass. Identify the changed and measured variables and review cutting and no-eating precautions. |
| Day 1 setup (15 min) | Explore Use adult-cut, matching 5 cm × 1 cm × 1 cm strips from one large potato. Record nine starting masses and lengths. Divide 100 mL final volume of each concentration into three labeled cups (about 30 mL each), put one strip in each of nine cups, cover and soak 24 hours at room temperature. Elapsed soak time is outside class time. |
| Day 2 results (25 min) | Explore Blot all nine strips consistently after soaking. Record final mass to 0.1 g, length and texture; clean the bench and wash hands. |
| Day 2 results (25 min) | Explain Calculate mass and percentage change for every strip, then compare replicate means and ranges across concentrations. Explain the observed pattern as net water movement across cell membranes in response to water-potential differences. Note that this model of tissue-level change is only a partial view of interacting organism systems. |
Discussion questions
1. Why might a potato strip gain mass in the 0% salt solution?
2. Why might a strip lose mass in a concentrated salt solution?
3. Why control the strip size and blotting method?
4. Why use three strips per concentration?
Common misconceptions
Differentiation
SUPPORT
- Provide pre-cut, labeled strips and a calculation template for final mass minus starting mass.
- Use a worked percentage-change example and a shared balance-reading demonstration.
- Offer the frame: “At __% salt, the strip changed by __ g (__%); this may be because __.”
EXTEND
- Add more replicate strips per concentration and compare means and ranges.
- Test additional concentrations and estimate where mean mass change approaches zero.
- Graph each replicate and the mean percentage mass change against salt concentration so variation remains visible.
Assessment rubric
| Criterion | Beginning | Developing | Secure |
|---|---|---|---|
| Fair comparison | Changes several conditions or omits the soak time. | Controls some conditions but uses mismatched strips or solution volumes. | Uses matched strips, equal solution volume per strip, three replicate cups per concentration, labeled solutions and the same 24-hour room-temperature soak. |
| Data record | Omits starting or final measurements. | Records masses but omits units, precision or solution labels. | Records labeled starting and final masses in grams to 0.1 g and observations. |
| Calculations and pattern | Does not calculate change or uses an unclear comparison. | Calculates some changes but has errors or no concentration comparison. | Correctly calculates mass and percentage change and compares all concentrations. |
| Explanation and safety | Claims salt mechanically pulls water or ignores safe handling. | Mentions osmosis but gives little evidence or safety detail. | Uses evidence to explain water movement across membranes, notes the model's limits, and follows cutting/no-eating precautions. |
Vocabulary
- Osmosis – Net movement of water across a selectively permeable membrane due to differences in water potential.
- Concentration – Amount of dissolved substance in a given volume of solution.
- Cell membrane – A selectively permeable boundary around a cell that regulates movement of substances.
- Mass change – Final mass minus starting mass, with a sign showing gain or loss.
- Percentage change – Mass change divided by starting mass, multiplied by 100%.
- Replication – Repeating a condition with multiple samples to account for natural variation.
Safety, cleanup and troubleshooting
BEFORE STUDENTS TOUCH ANYTHING
- An adult cuts potato strips on a stable cutting board, keeping the blade away from hands; alternatively, provide pre-cut strips or a safe cutter under direct supervision.
- Do not eat the potato strips or solutions. Wash hands after handling samples and clean the balance area.
- Keep cups stable on a tray and wipe water or salt spills promptly.
Troubleshooting: If strips differ in size, use matched pieces cut from the same potato and note any unavoidable differences. Blot each strip with the same gentle method before weighing. Check the balance is level and zeroed; repeat a reading if it drifts. Dispose of solutions as directed by the teacher.