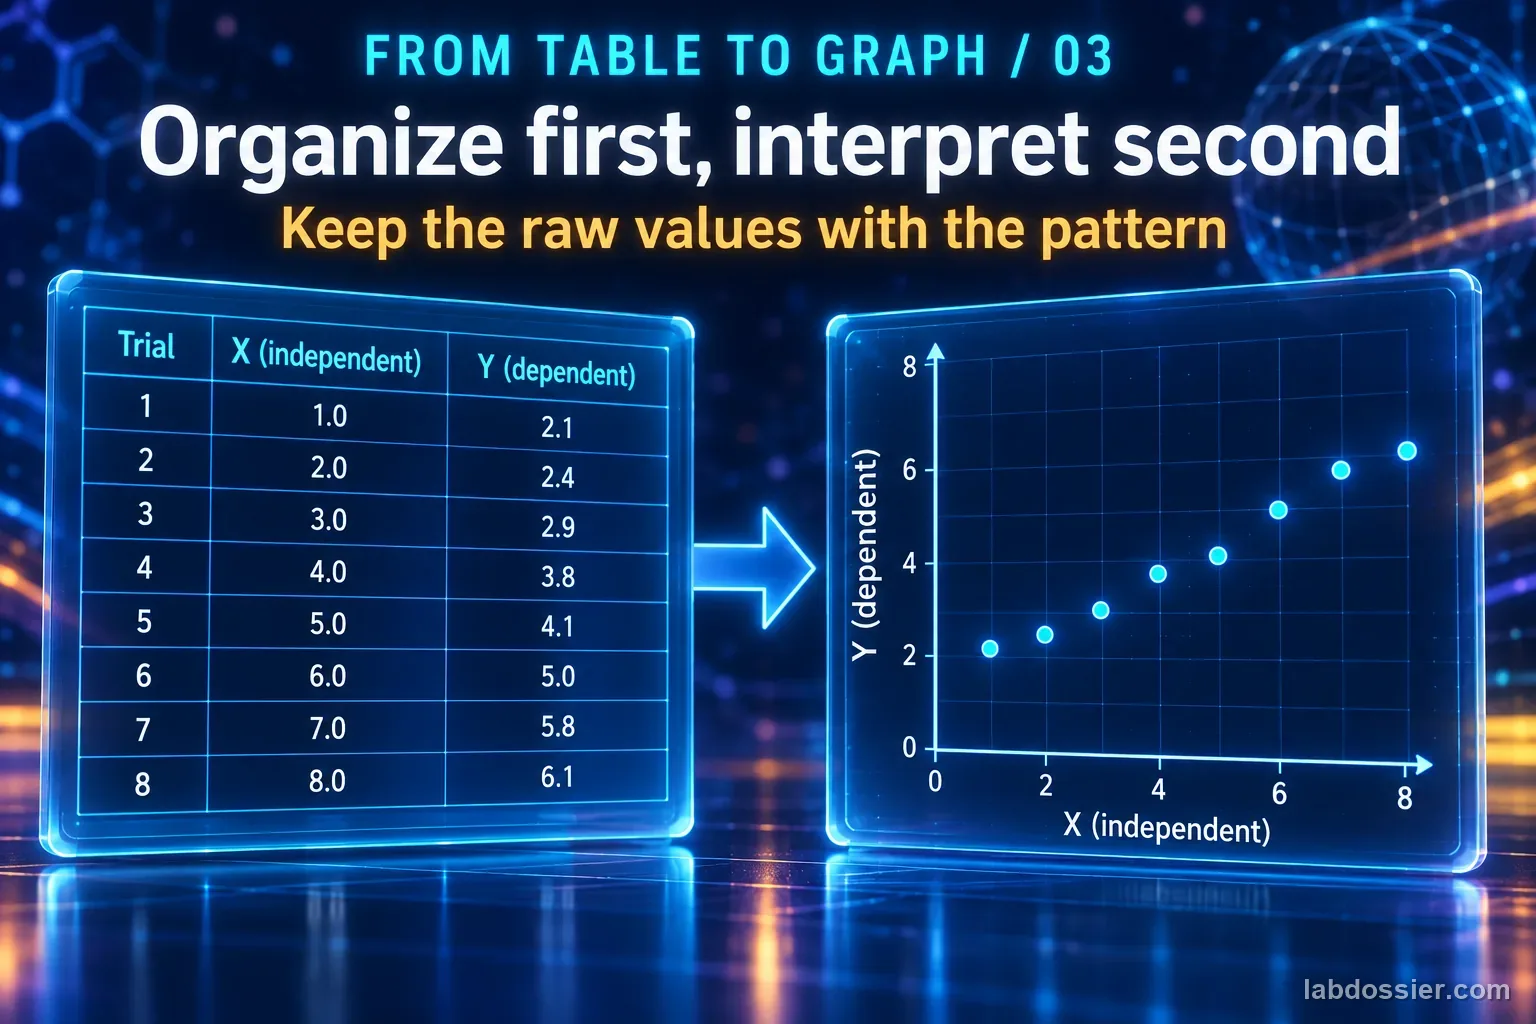
What explains the result?
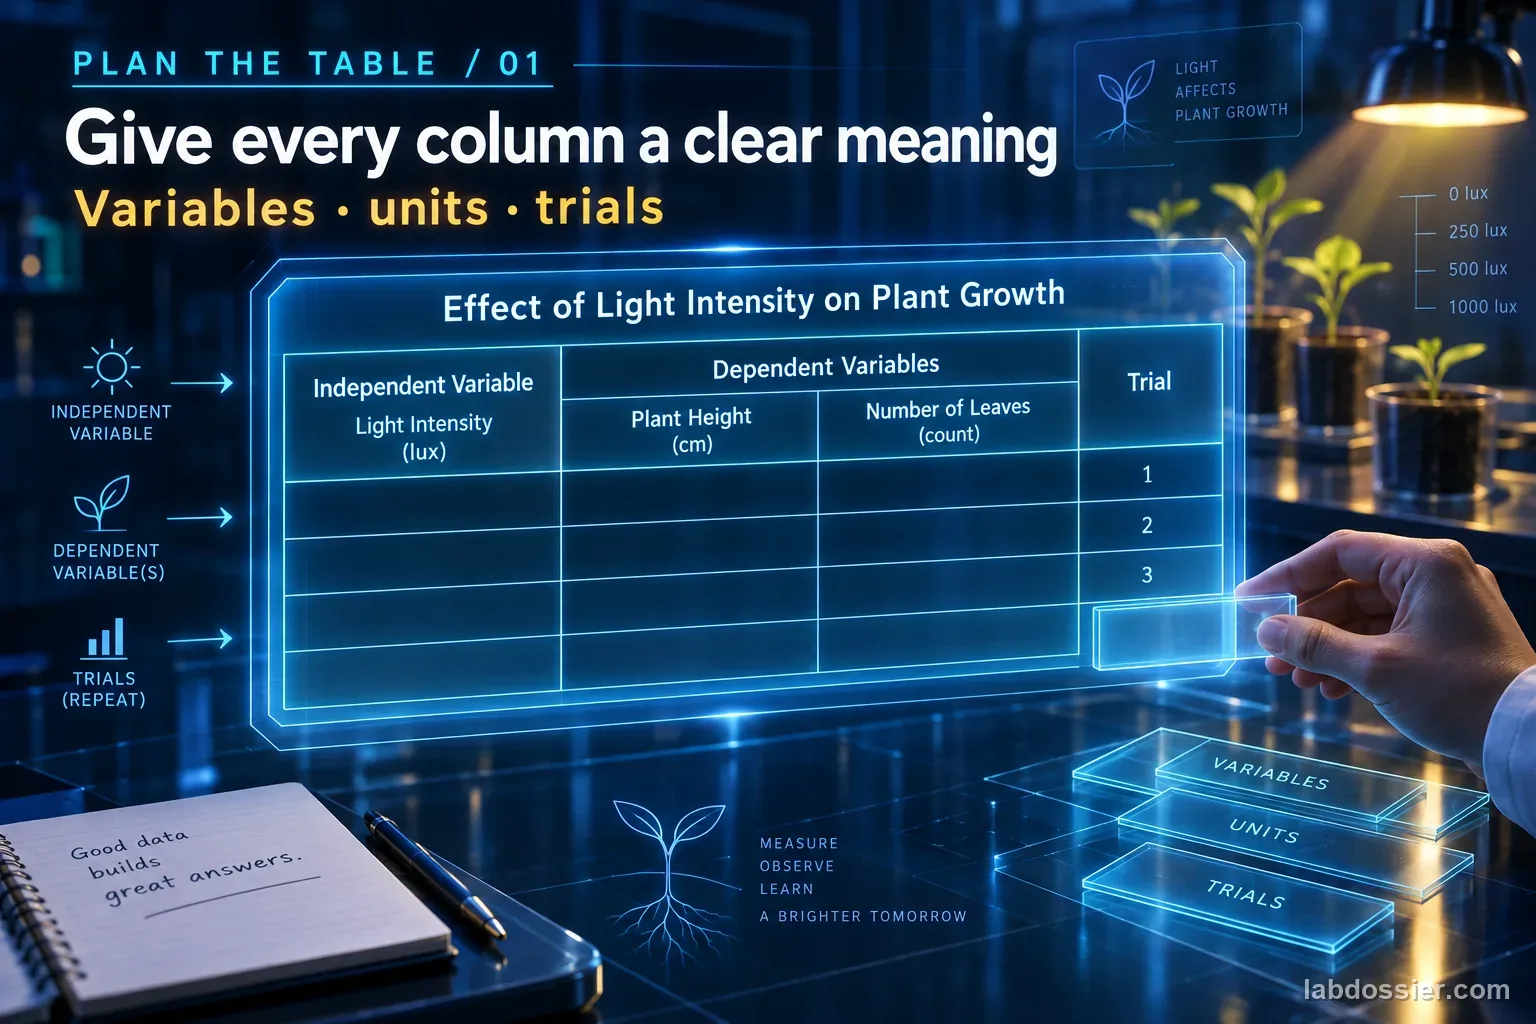
A useful data table names each variable, includes units, keeps trials distinct, and records the tested conditions.
LAB SKILLS · GRADES 4–12
INVESTIGATION QUESTIONWhich table lets another student compare trials and repeat the investigation?
Name each quantity, add headings for factor, trial, and response.
A useful data table names each variable, includes units, keeps trials distinct, and records the tested conditions.
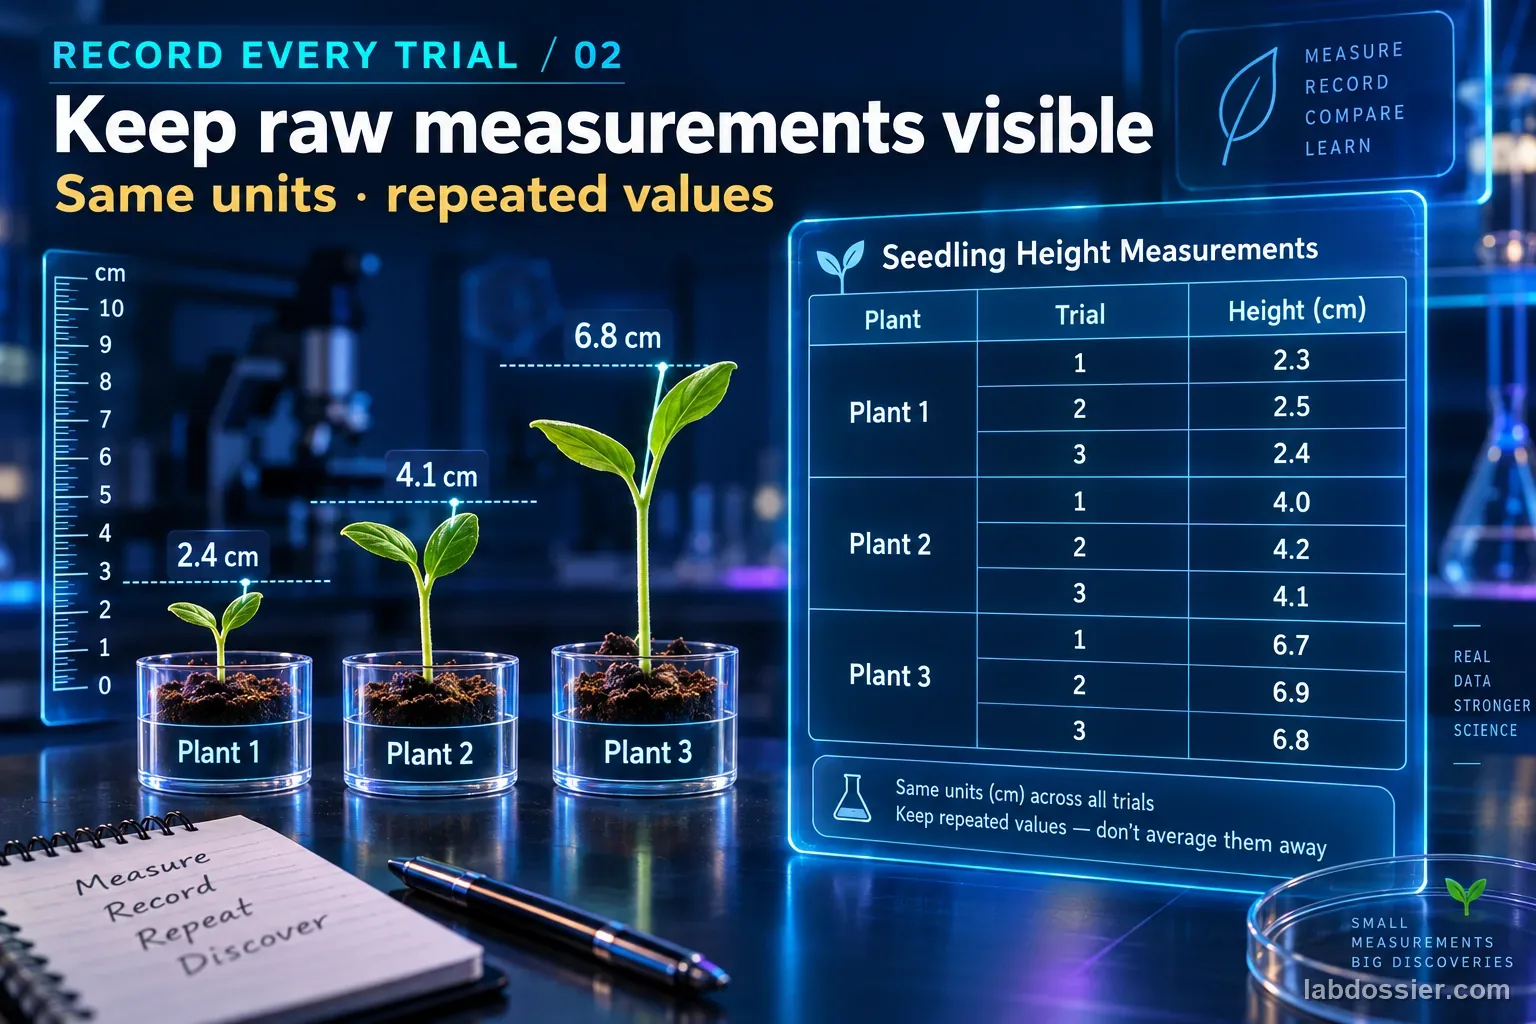
Well-structured data tables support lab partners, research teams, quality checks, and later analysis.
A complete table cannot correct measurements collected with a biased or inconsistent method.
DEDICATED PRACTICE ROOM · LAB SKILLS
Which table lets another student compare trials and repeat the investigation?
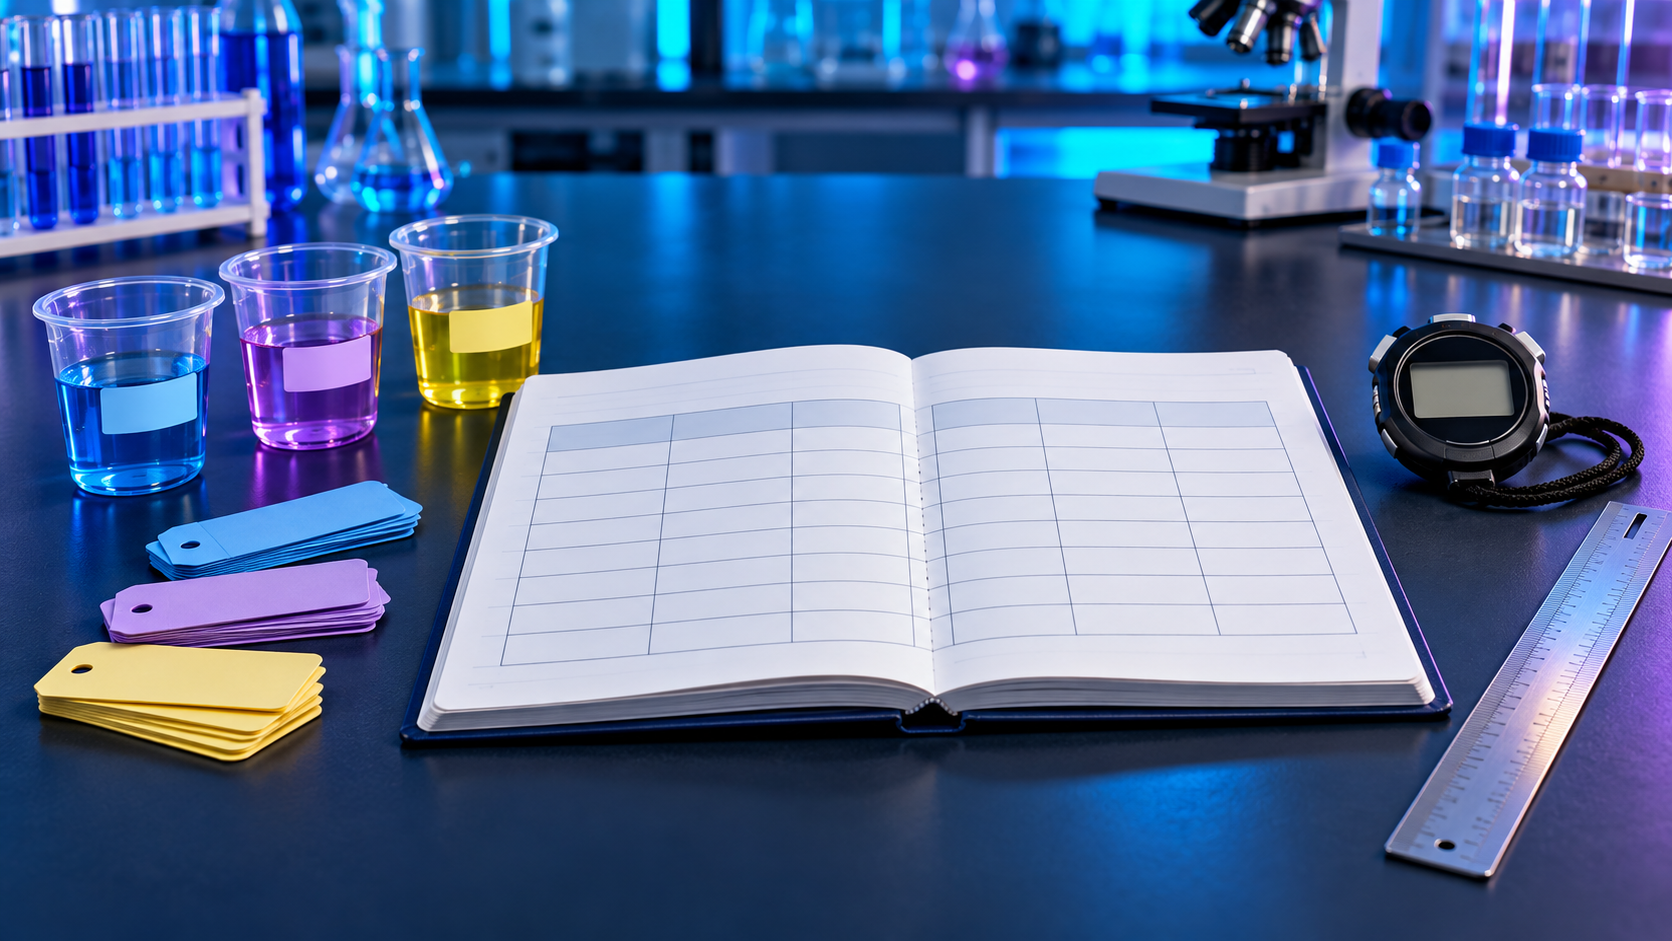
Select the features that help another student distinguish conditions, units, and repeated trials. A complete table cannot correct measurements collected with a biased or inconsistent method.
| Water temperature (°C) | Trial | Time to first bubble (s) |
|---|---|---|
| Cold | 1 | _____ |
| Room | 2 | _____ |
| Warm | 3 | _____ |
A useful data table names each variable, includes units, keeps trials distinct, and records the tested conditions.
Well-structured data tables support lab partners, research teams, quality checks, and later analysis.
MODEL LIMIT A complete table cannot correct measurements collected with a biased or inconsistent method. The activities on this page do not store classroom measurements.