LF-25 · TEACHER LESSON PLAN
Paper towel absorbency lab
Compare paper towel products at a defined first-drip endpoint
Driving question
Learning objectives
- Students prepare three equal 10 × 10 cm samples from each of three identified paper towel products, keeping plies as sold.
- Students measure milliliters of clean water added at 1 mL every 3 seconds before the first visible drip in three trials per product.
- Students compare each product's mean and range, distinguishing the first-drip proxy from retained mass and absorption rate.
Standards
| Dimension | Alignment |
|---|---|
| Performance expectation | MS-PS1-1Develop models to describe the atomic composition of simple molecules and extended structures. (Partial alignment: this is the performance expectation the lab lists, but the activity compares how much water paper towel brands hold before dripping rather than building atomic models.) |
| Practices | SEP 4Analyze and interpret data. |
| Core idea | PS1.AEach pure substance has characteristic physical and chemical properties (for any bulk quantity under given conditions) that can be used to identify it. |
| Crosscutting | Cause and effectCause and effect relationships are routinely identified, tested, and used to explain change. |
Standards text paraphrased from nextgenscience.org. Alignment is partial; this hands-on activity does not cover every part of the performance expectation. CCC wording not independently verified.
State standards crosswalk
Use the row as a planning crosswalk, then confirm local district pacing and grade placement. “Partial” labels describe a skill connection, not full mastery of the complete standard.
| State | Verified standard | How this lesson aligns | Official source |
|---|---|---|---|
| California | CA NGSS 3-5-ETS1-3 | Partial. Equal areas, controlled water addition, and repeat trials model a fair test, but this lesson compares material brands instead of testing a prototype against a design problem. | Open standard ↗ |
| Texas | Science.5.1(B) | Partial. Students plan and conduct a descriptive investigation of towel properties, but the lesson's brand comparison is narrower than the full range of descriptive investigations and engineering practice in the expectation. | Open standard ↗ |
| Florida | SC.4.N.1.1 | Partial. Students conduct a team investigation and use measurements to explain their observations; the standard also includes source-based inquiry and broader explanation work beyond this short test. | Open standard ↗ |
| New York | 3-5-ETS1-3 | Partial. Students control sample area, addition method, and repeat trials in a fair comparison, but do not test a model or prototype for improvement as this performance expectation specifies. | Open standard ↗ |
| Pennsylvania | 3.2.5.B | Partial. Students measure absorbency as a material property, but the examples in this standard do not name absorbency, and the lesson does not identify unknown materials from several properties. | Open standard ↗ |
Materials and prep timeline
PER GROUP
- Three paper towel products; identify exact product and ply
- Nine equal 10 × 10 cm squares (three fresh samples per product; retain plies as sold)
- One clean catch tray, dried between trials
- Clean room-temperature water and a 1 mL syringe or graduated cylinder
- Scissors, ruler, labels, timer, recording sheet and floor-drying cloth
TEACHER ONLY
- Prepare nine fresh equal-area squares, retain plies as sold, and label each exact product. Use a new square for every trial.
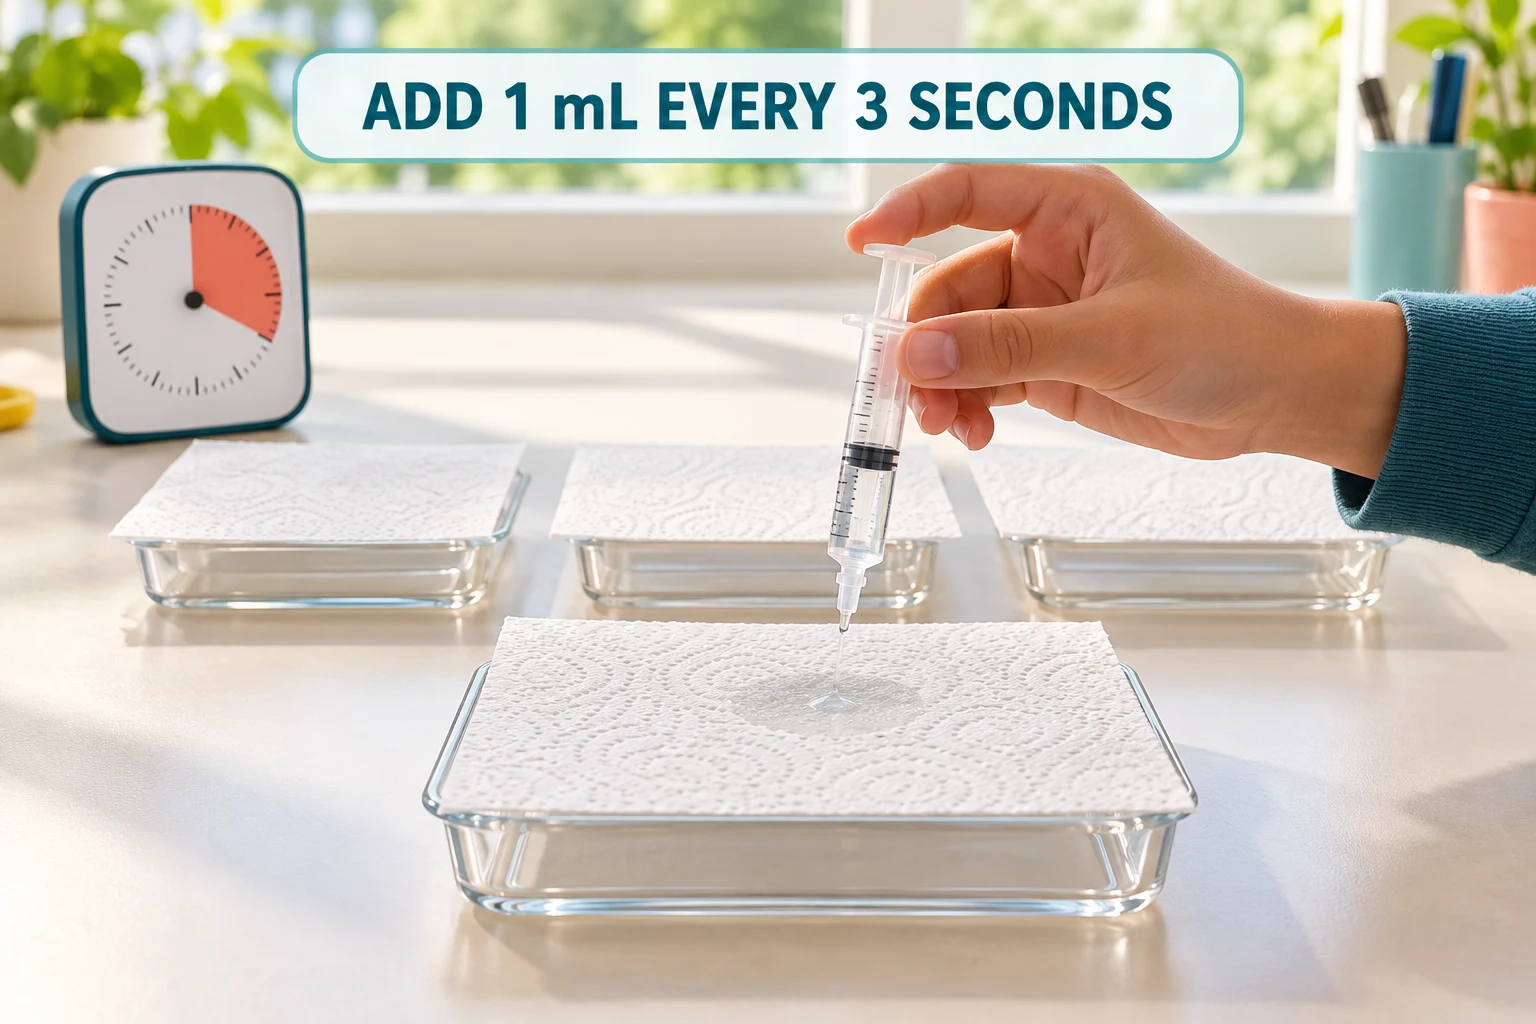
- Add measured 1 mL increments at the center, waiting exactly 3 seconds between additions. Define the endpoint as the first visible drop passing through the underside.
- Use one catch tray at a time and dry it before reuse. Work over a sink or tray, keep the floor dry, and provide a cloth for spills and handwashing.
CLASS-SIZE KIT PLANNER
One per-group kit contains every item in the team materials list above. Groups are balanced around the listed 3–4 students target.
| Students | Groups | Per-group kits | Student sheets | Suggested group split |
|---|---|---|---|---|
| 20 | 6 | 6 complete kits | 20 copies | 2 groups of 4 and 4 groups of 3 |
| 25 | 7 | 7 complete kits | 25 copies | 4 groups of 4 and 3 groups of 3 |
| 30 | 8 | 8 complete kits | 30 copies | 6 groups of 4 and 2 groups of 3 |
Predict which brand may hold more water. Agree that the endpoint is the first visible drip and that water is added slowly.
Label the exact products and prepare three 10 × 10 cm squares per product, keeping plies as sold.
Add 1 mL to the center every 3 seconds. Stop at the first visible drop passing through, record total mL, and dry the tray between samples.
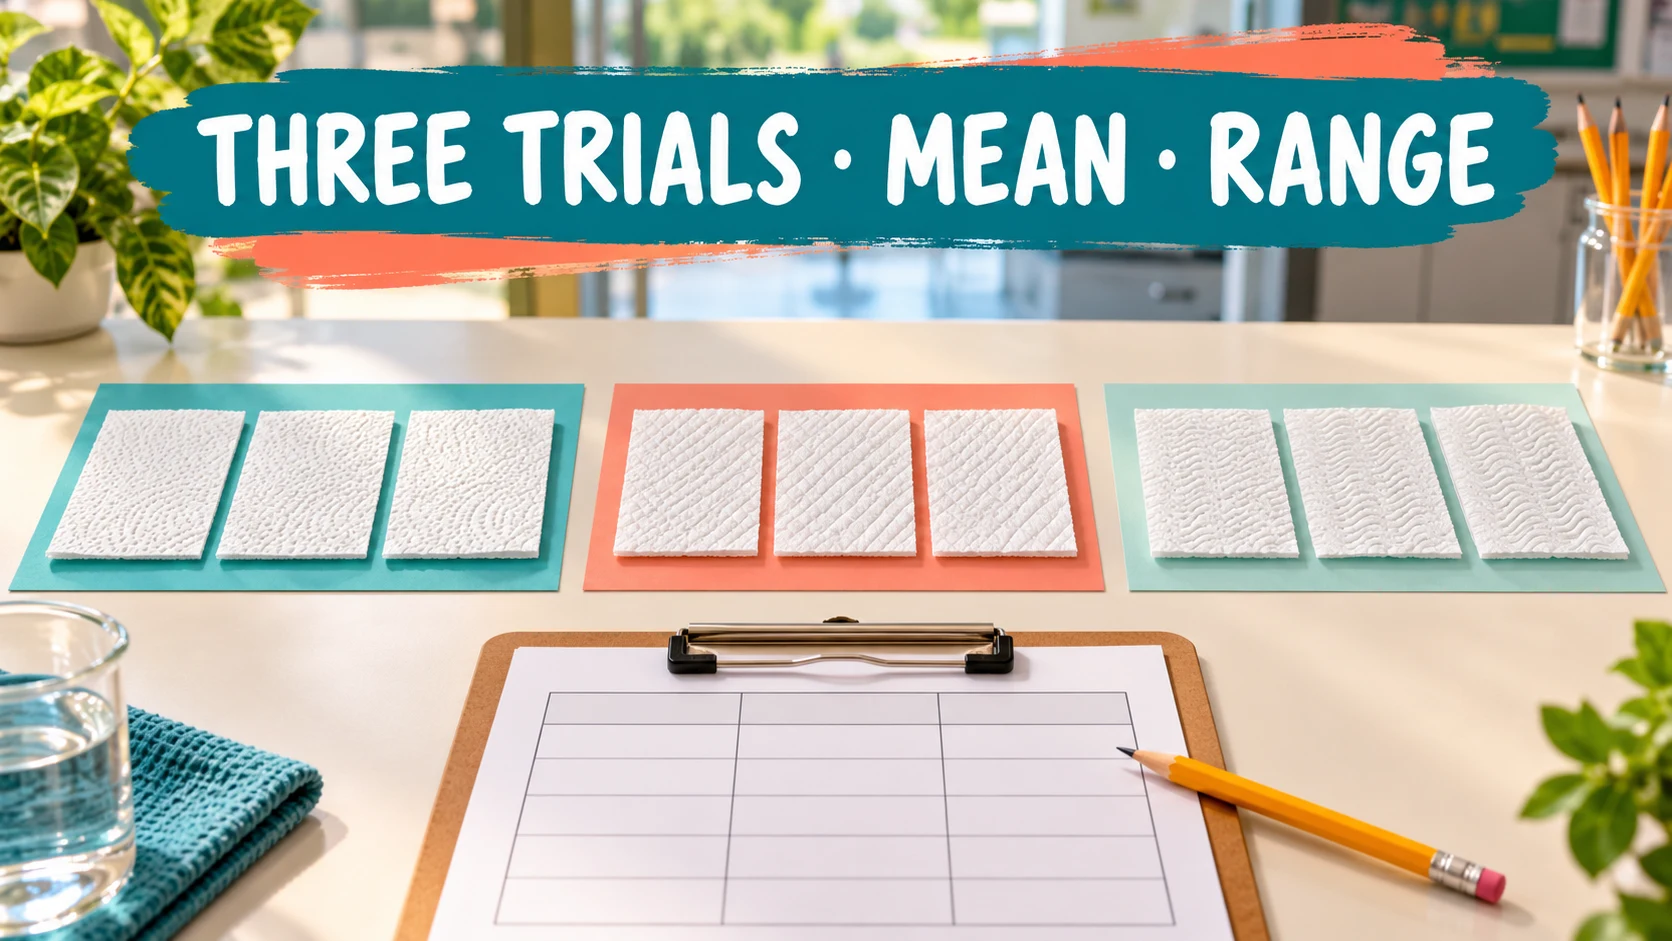
Test three fresh squares per product. Keep raw values, then calculate each mean and range (highest minus lowest).
Compare brand averages and discuss how fiber structure and pour rate affect the result. Wipe drips and dry the floor.
Lab figures and data visuals
Reviewed article images support the lesson flow. Use the tables and student sheet to record actual observations; pictured patterns are not target results.
Printable shopping list
Shopping and staging checklist
Multiply the per-group kit contents by the class-size planner. The teacher section includes teacher-provided materials and setup or safety notes.
PER-GROUP KITS
- Three paper towel products; identify exact product and ply
- Nine equal 10 × 10 cm squares (three fresh samples per product; retain plies as sold)
- One clean catch tray, dried between trials
- Clean room-temperature water and a 1 mL syringe or graduated cylinder
- Scissors, ruler, labels, timer, recording sheet and floor-drying cloth
TEACHER-PROVIDED MATERIALS + SETUP RULES
- Prepare nine fresh equal-area squares, retain plies as sold, and label each exact product. Use a new square for every trial.
- Add measured 1 mL increments at the center, waiting exactly 3 seconds between additions. Define the endpoint as the first visible drop passing through the underside.
- Use one catch tray at a time and dry it before reuse. Work over a sink or tray, keep the floor dry, and provide a cloth for spills and handwashing.
QUANTITIES BY CLASS SIZE
| Material | Per group kit | 20 students | 25 students | 30 students |
|---|---|---|---|---|
| Paper towels from three products, three equal squares per product | 9 squares | 54 squares | 63 squares | 72 squares |
| One clean catch tray, dried between trials | 1 | 6 | 7 | 8 |
| Clean water and a 1 mL syringe or graduated cylinder | water for nine trials and 1 measuring tool | water for 54 trials and 6 tools | water for 63 trials and 7 tools | water for 72 trials and 8 tools |
| Rulers, scissors, and labels | 1 of each | 6 of each | 7 of each | 8 of each |
| Drying cloths | 1 | 6 | 7 | 8 |
| Student data sheets | 1 per student | 20 copies | 25 copies | 30 copies |
Prepare 6 kits for 20 · 7 kits for 25 · 8 kits for 30 students.
Lesson flow
| Minutes | What happens |
|---|---|
| 0–4 min | Engage Predict which brand may hold more water. Agree that the endpoint is the first visible drip and that water is added slowly. |
| 4–9 min | Explore Label exact products and prepare three equal 10 × 10 cm squares per product, keeping plies as sold. |
| 9–21 min | Explore Add 1 mL at the center every 3 seconds. Stop at the first visible drop passing through, record total mL, and dry the tray between trials. |
| 21–27 min | Explain Test three fresh squares per product. Keep raw values, then calculate each mean and range (highest minus lowest). |
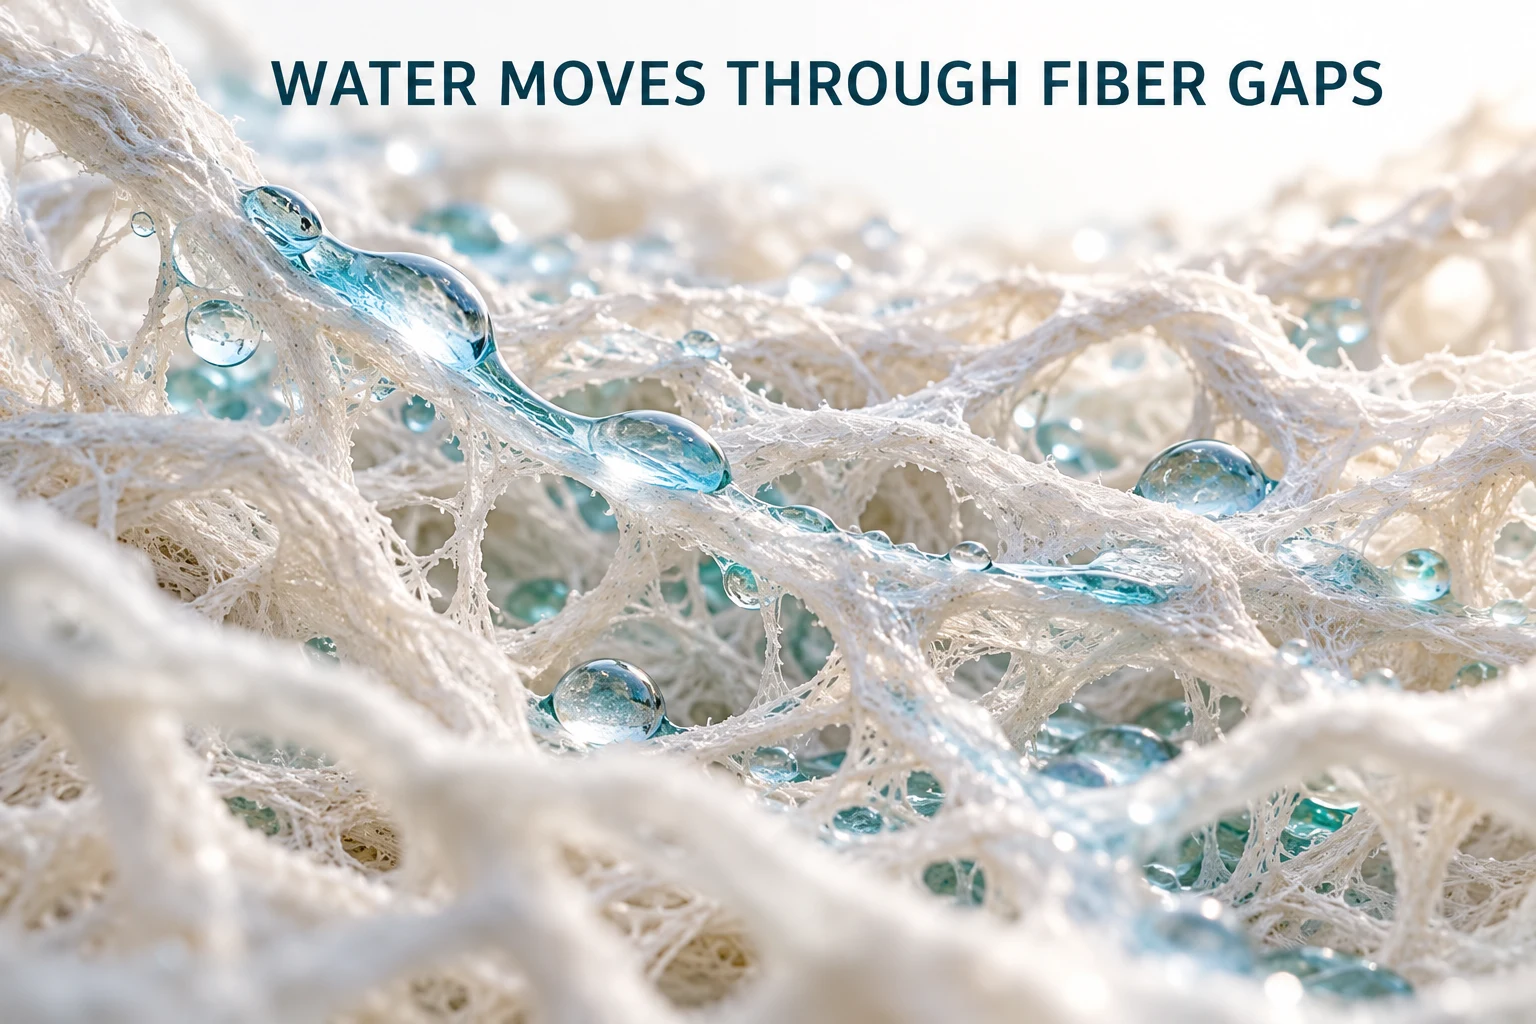
| 27–30 min | Evaluate Compare brand averages and discuss how fiber structure and pour rate affect the result. Wipe drips and dry the floor. |
Discussion questions
1. Why must all towel squares have the same area?
2. Why add exactly 1 mL every 3 seconds?
3. Does the brand with the largest first-drip volume absorb water fastest?
4. Why keep a range as well as the mean?
Common misconceptions
Differentiation
SUPPORT
- Provide pre-cut, labeled equal-area squares and a clean tray to dry between trials.
- Use a 1 mL syringe with a large scale; one student adds and times while another watches for the first visible drip.
- Offer: ‘Product __ readings were __, __ and __ mL; mean __ mL; range __ mL.’
EXTEND
- Run more fresh-square trials per product and compare the mean and range.
- Compare equal-area samples with different layer counts as a new variable while holding the addition pace constant.
- Weigh dry and wet samples as a separate retained-mass follow-up after a fixed soak and drain time.
Assessment rubric
| Criterion | Beginning | Developing | Secure |
|---|---|---|---|
| Matched samples | Uses different sample sizes or mixes brands without labels. | Labels brands but leaves one sample-size or tray condition unmatched. | Tests equal-area labeled samples over catch trays with a fresh square for each repeat. |
| Endpoint and records | Does not identify the first drip or leaves values blank. | Records some water amounts but changes addition pace or omits mL. | Adds 1 mL every 3 seconds and records three first-drip readings per product. |
| Mean, range and comparison | Does not summarize or names a product without data. | Calculates one mean correctly or compares values without noting variation. | Calculates each three-trial mean and range correctly and compares products using the table. |
| Explanation and cleanup | Claims capacity equals absorption speed or leaves spills. | Mentions fiber structure but needs reminders about drips or test limits. | Connects structure to water holding, distinguishes capacity from speed and dries the work area. |
Vocabulary
- Absorb – To take liquid into a material or its spaces.
- First drip – The first visible drop that passes through the towel sample.
- Fiber – A thin strand of material that makes up paper towel structure.
- Capillary action – Movement of liquid through narrow spaces between fibers.
- Mean – The sum of three trial measurements divided by three.
- Range – The highest trial value minus the lowest trial value.
- Capacity – A measured water-holding outcome; this first-drip proxy is not total retained mass.
Safety, cleanup and troubleshooting
BEFORE STUDENTS TOUCH ANYTHING
- Add exactly 1 mL every 3 seconds; a different pace can change the first-drip reading.
- Cut every product's sample to exactly 10 × 10 cm and keep its plies as sold.
- Use clean water only; contain spills on the work surface and dry the floor promptly.
- Do not drink test water or put used towels in your mouth; wash hands after handling wet materials.
Troubleshooting: If the dropper pace changes or the tray is wet before a trial, note the issue, dry the tray, and repeat with a fresh equal-area square using 1 mL every 3 seconds. Wipe spills promptly and dry the floor before walking.