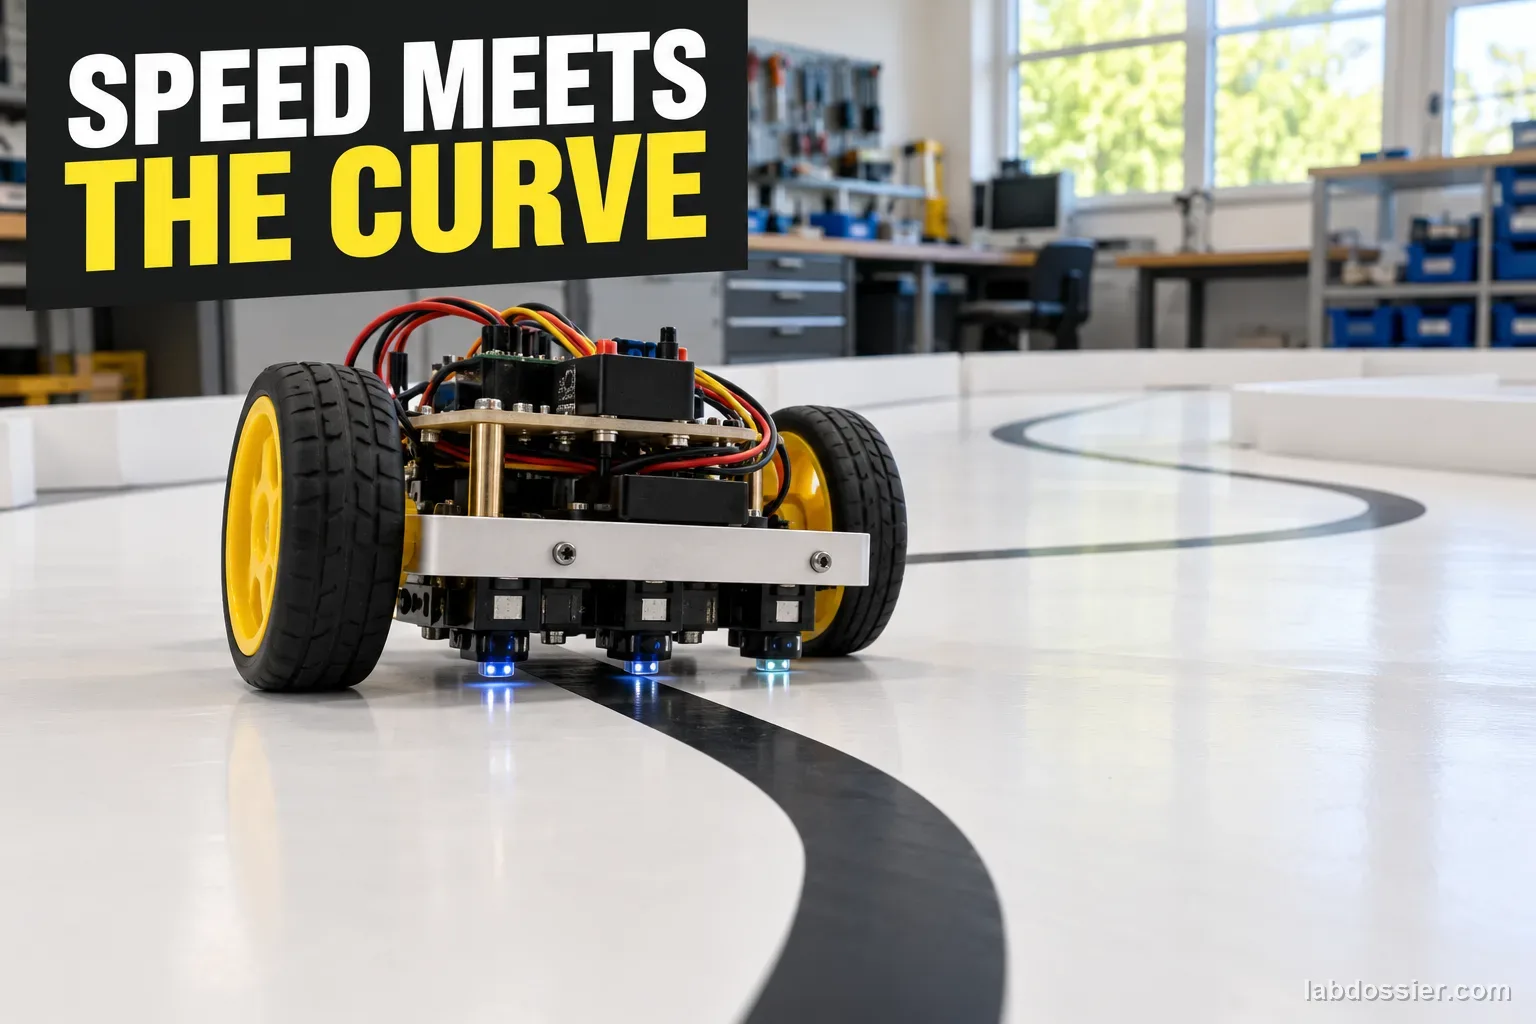
How does speed affect a line-following robot on tighter curves?
01 // Question
As a line-following robot moves faster, how does its success rate change on curves with different measured radii?
Use a small, low-speed classroom robot on a flat enclosed course under teacher supervision. These results cannot predict road-vehicle behavior or establish a universal safe speed.
02 // Variables
Independent
Robot speed setting and curve radius- Three low-to-high speed settings approved for the specific robot
- Three measured curve radii: broad, medium and tight for that robot
Dependent
Line-following completion and lap time- Successful one-lap runs out of five
- Time for each completed lap
- Number and location of line-loss events
03 // Hypothesis
IF the robot's commanded speed rises or the measured curve radius becomes tighter, THEN the proportion of successful laps may decrease and line-loss events may increase, BECAUSE the robot has less time to sense and correct lateral error while turning, but the pattern depends on sensor geometry, controller tuning, wheel grip and the course.
04 // Procedure
1. Approve and bound the robot test
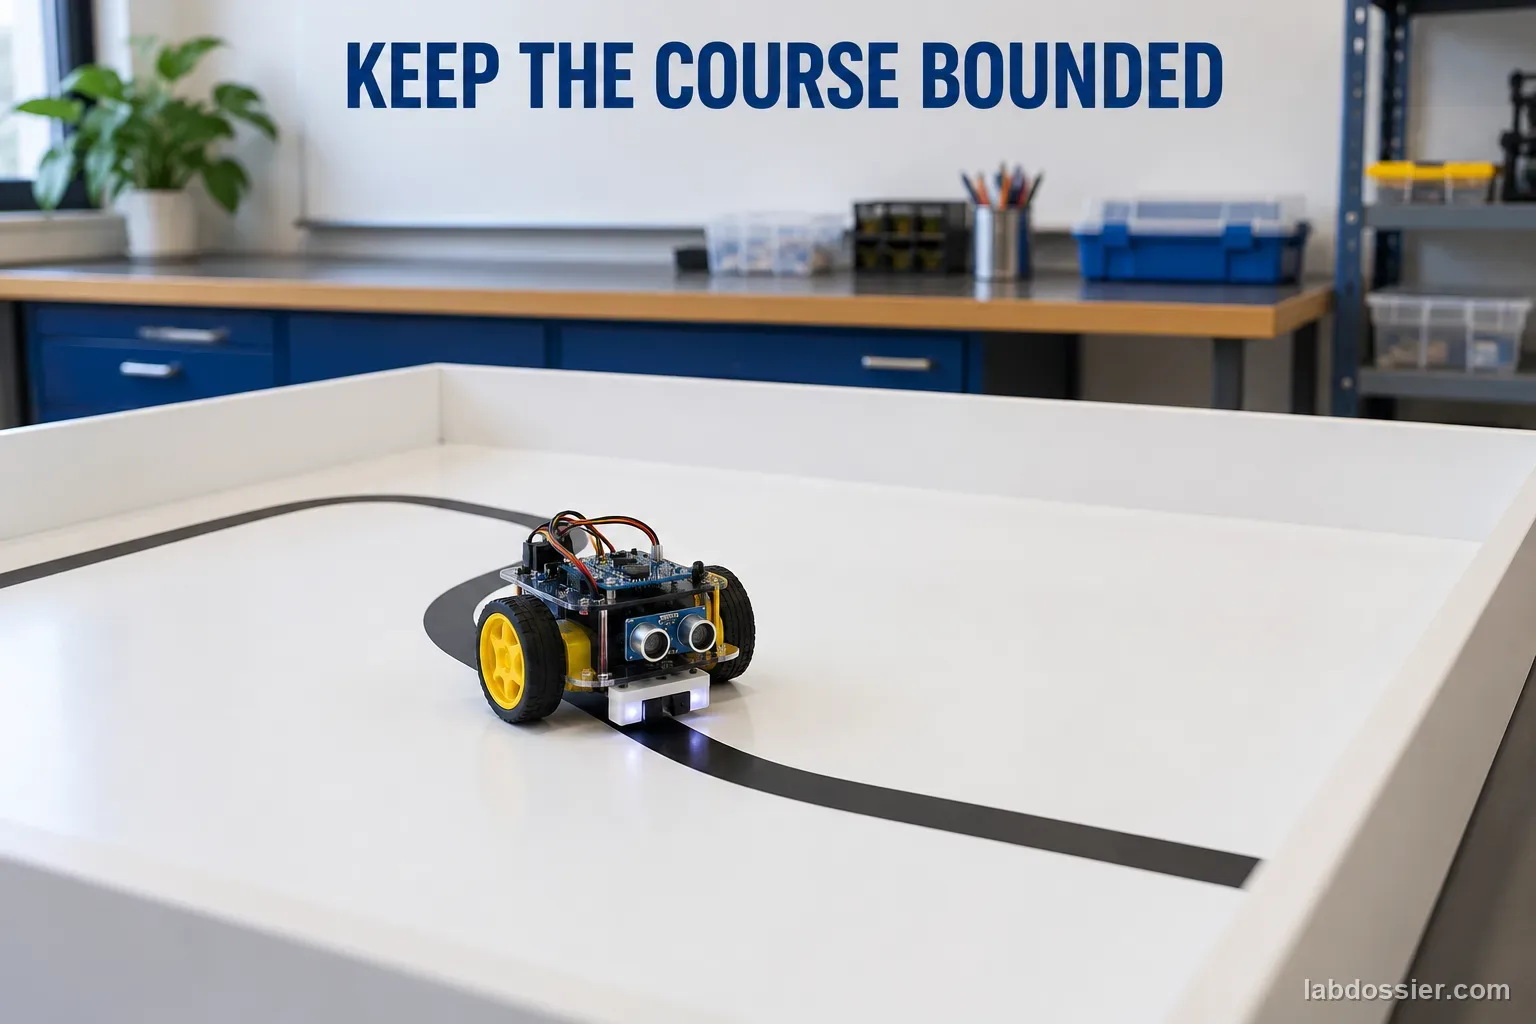
Use a small classroom line follower at speeds the teacher has checked on the floor. Run it on a flat tabletop or floor lane inside a clear boundary; keep hands, hair and loose items away from wheels. Stop and power down before moving tape, adjusting sensors or handling the battery. Do not use a robot near stairs, people traffic, roads or fragile equipment.
2. Build three measured curve tracks
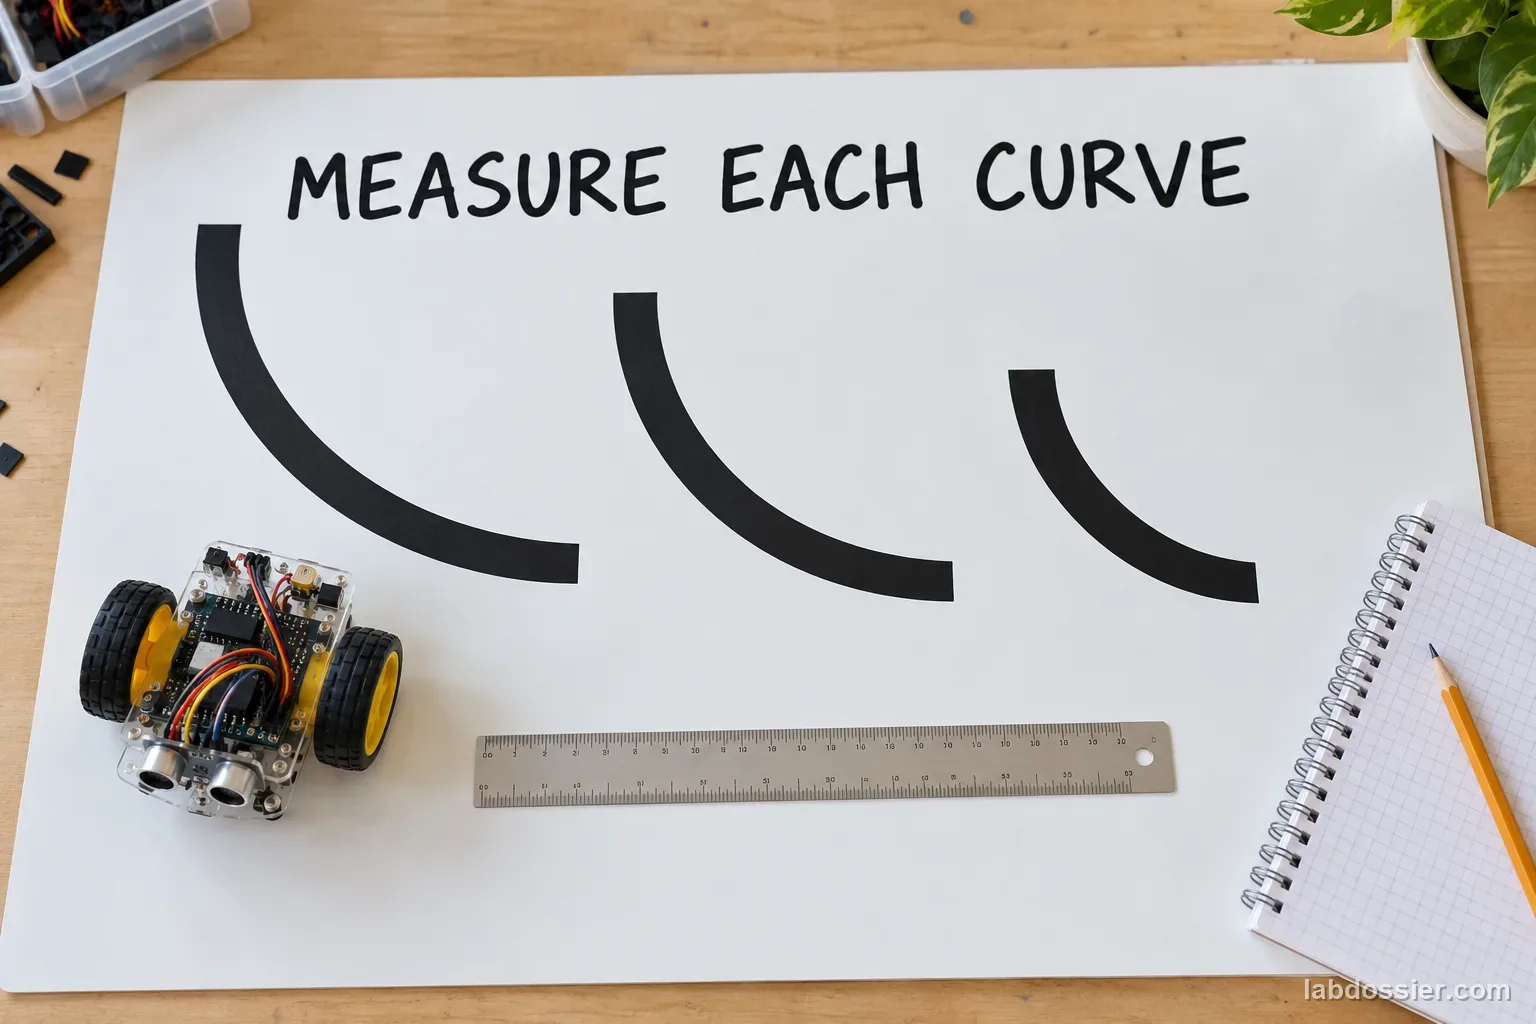
Use the same dark tape or printed line on the same flat light-colored board. Make three smooth curve sections with broad, medium and tight measured radii that fit the chosen robot; record the radius in centimeters and keep line width constant. Join each with the same straight approach and exit sections so every course has the same lap length where practical. Do not change curvature during a run.
3. Choose safe speed settings and freeze the controller
With adult supervision, select three low-to-high settings that stay within the robot maker's instructions and the course boundary. Record the actual setting or measured speed; do not copy another robot's values. Verify the sensor height, reflectance threshold, controller gains, wheel condition and battery before the trials, then leave them unchanged.
4. Run the 45 condition trials
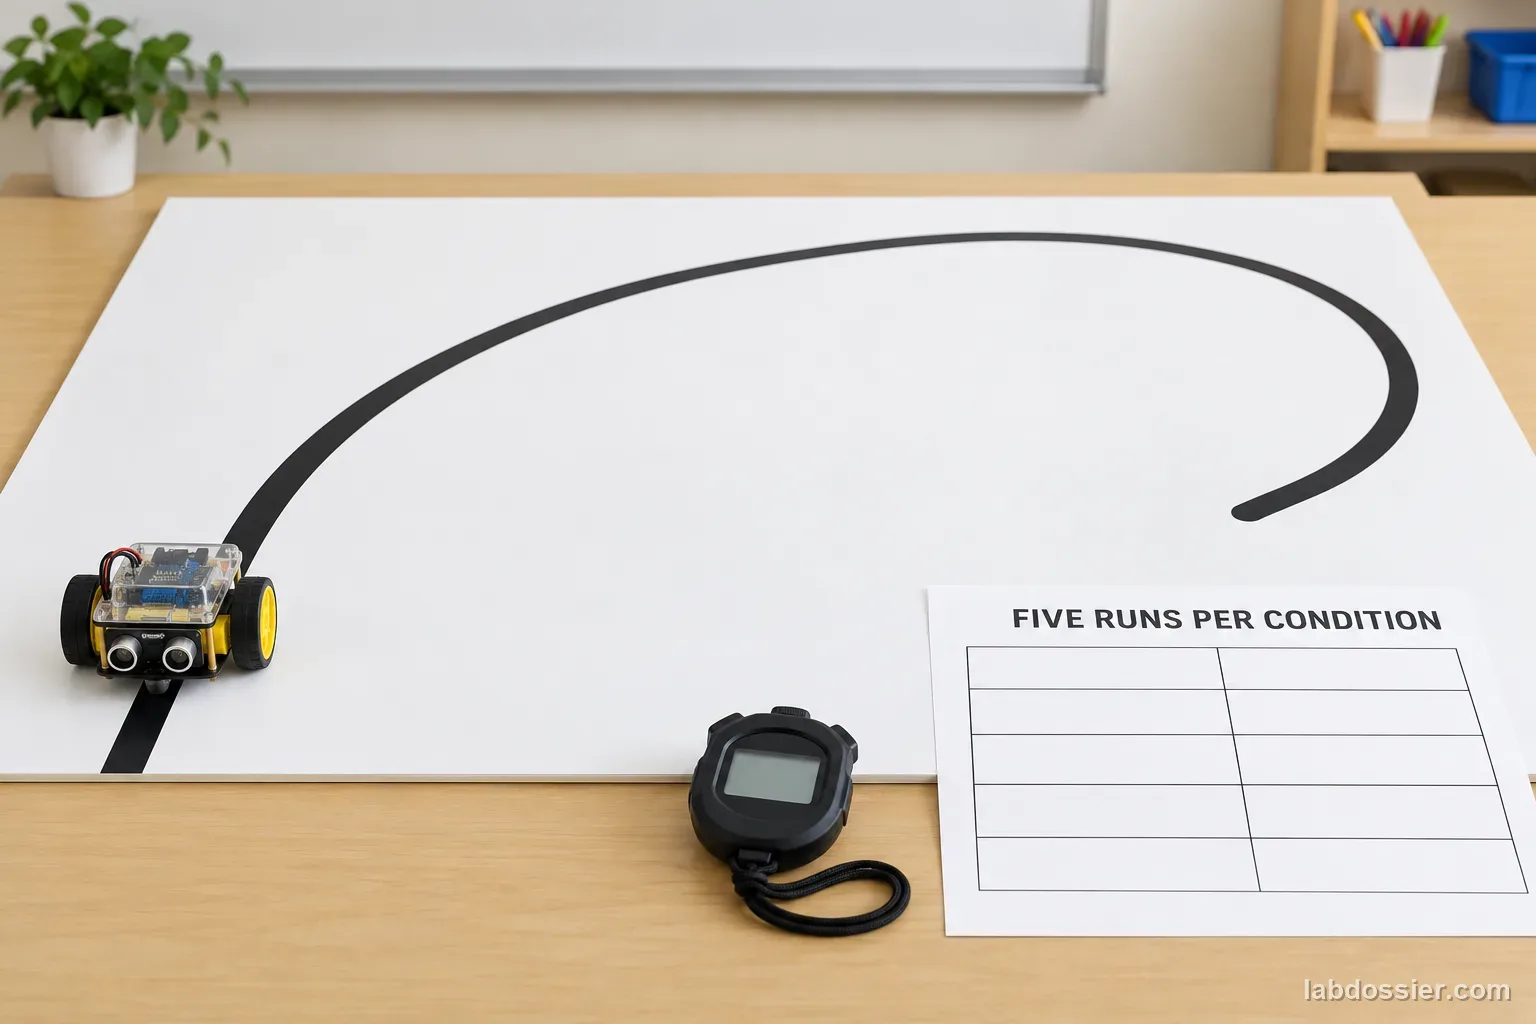
Test each of the three radii at each of the three speeds, for five trials per combination. Rotate or randomize the condition order to reduce battery and learning-order effects. Start from the same mark and use one lap. Count a trial as successful only if the robot completes the lap without leaving the marked course or needing a manual reset. Record every sensor-line-loss event and its duration separately; a brief loss that recovers is useful evidence, not a reason to discard the run. Reset the robot to the same start position.
5. Calculate success and compare lap time
For each radius–speed pair, calculate success percentage as successful laps ÷ 5 × 100. Keep all five trial outcomes, record lap time only for completed laps, and report the median time beside the success count. Plot success percentage against speed setting with a separate line for each measured radius; show the small denominator of five and do not imply precision beyond the trials.
6. Interpret the control-system limits
Science Buddies recommends beginning with a straight line and gradual curves, and notes that sharp turns, sensor height, line width and a bumpy track can affect following. A 2026 educational PID study reports testing straight, curved and 90-degree paths on its own robot, but its tuned gains are platform-specific. Explain how this experiment differs from both sources: it varies speed and radius with one fixed robot/controller and counts repeated completions. It cannot identify the best tuning for all robots or transfer to vehicles on public roads.
Materials // Prepare the bench
- teacher-approved small line-following robot
- flat pale board or floor lane
- dark tape or approved printed track
- ruler or flexible tape measure
- stopwatch
- data table
- clear course boundary
05 // Data table
| Curve radius (cm) | Speed setting | Trial 1 | Trial 2 | Trial 3 | Trial 4 | Trial 5 | Successes / 5 | Median lap time (s) |
|---|---|---|---|---|---|---|---|---|
| Broad | Low | |||||||
| Broad | Medium | |||||||
| Broad | High | |||||||
| Medium | Low | |||||||
| Medium | Medium | |||||||
| Medium | High | |||||||
| Tight | Low | |||||||
| Tight | Medium | |||||||
| Tight | High |
Define one trial before starting
| Decision | Rule for every run |
|---|---|
| Start | Same marked position and robot orientation |
| Success | One lap completed without leaving the course or manual reset |
| Reset | Power down, place robot back at the same mark and check track remains flat |
| Record | Actual speed setting, radius, success/failure, lap time, and every sensor-loss event and duration |
Why faster and tighter may be harder
| Change | Possible effect | Other factors to keep fixed |
|---|---|---|
| Higher speed | Less time for sensing and correction; more overshoot may occur | Controller gains, battery, sensor delay |
| Smaller curve radius | Larger direction change per distance traveled | Line width, track flatness, sensor placement |
| Both together | Could raise off-track probability in this particular robot | Do not infer road-car safety or every line-follower design |
Formula Success rate (%) = successful laps ÷ 5 trials × 100. A 4-of-5 result is 80% for this small sample; it is not a long-run reliability guarantee.
06 // What to expect
A higher speed or tighter curve can change line-following success, but the direction and size of the effect depend on the robot and course.
One missed lap is 20 percentage points when only five trials are run, so retain individual trials and avoid overclaiming.
Sensor position, line width, reflectance, floor, battery and controller settings can alter the observed pattern.
07 // Lab notes
- Check the manufacturer's speed, battery and operating instructions. Do not change controller settings mid-test or exceed the robot's rated limits.
08 // Remember
Keep the course and robot fixed while you vary speed and curve radius. A line follower's curve limit belongs to the tested robot and setup.
09 // A line follower is a feedback loop with limits
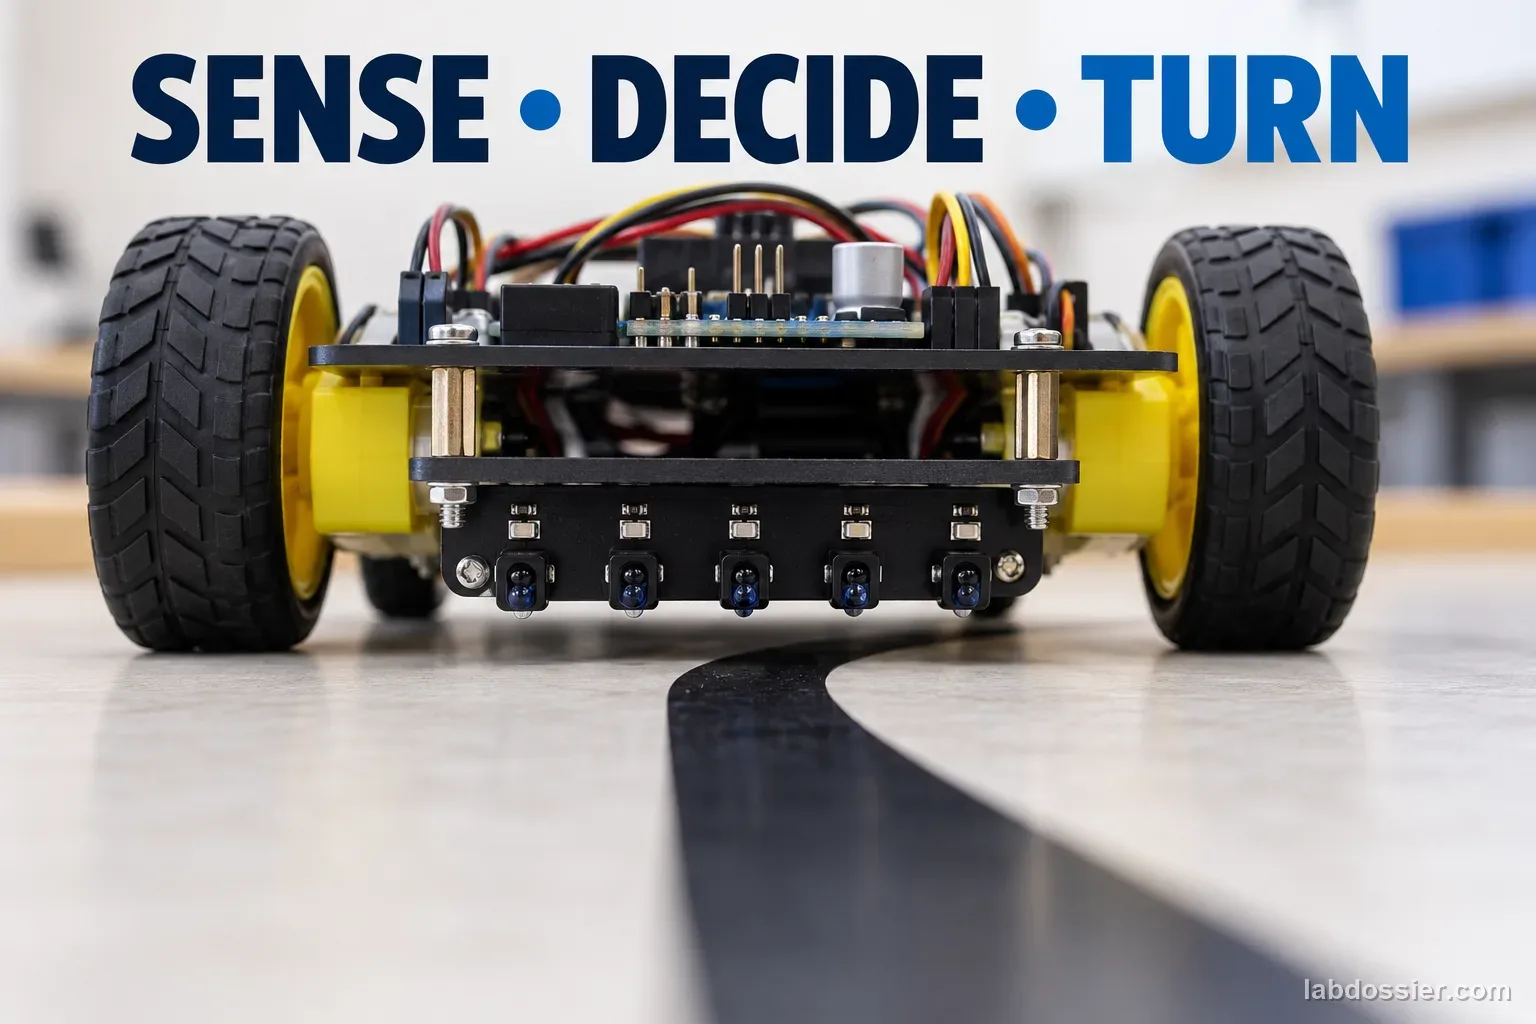
Reflectance sensors estimate where the dark line sits under the robot; a controller then changes the wheel motors to steer back toward it. When the robot moves faster, it travels farther between sensing and correction. A tighter curve also asks the chassis to change direction over a shorter distance, but the effect depends on the sensor layout, controller, wheels and track.
The experiment compares a small robot's actual outcomes across three measured radii and three manufacturer-approved settings. A success is one complete lap without leaving the marked course or needing a manual reset. Record every sensor-line-loss event and its duration separately, including brief losses that recover. These classroom-defined criteria describe this trial; they are not a standard performance rating.
10 // Start with the course geometry
Science Buddies recommends first checking the robot on a straight line and then using gradual curves; its troubleshooting notes also call out sensor height, track flatness and line width. This article builds on that advice with three recorded curve radii and matched straight approach/exit segments, then crosses radius with speed rather than changing the line or sensor at the same time.
TeachEngineering's line-follower challenge emphasizes sensing, programming, repeated testing and redesign on a supplied track. It offers a useful classroom workflow, but its challenge rubric is not a controlled speed-by-radius dataset. Here, the controller stays frozen so the two planned variables can be compared.
11 // Research tuning values are platform-specific
Tran and colleagues' 2026 educational line-follower paper reports testing straight sections, curves and 90-degree turns while tuning PID gains on its own robot. It reports one set of selected gains (Kp 65, Ki 0.1, Kd 13) for that system. Those values are not generic instructions: motor output, sensor placement, code, track and speed change the controller response.
This activity asks whether success changes with speed and curve radius under one fixed controller. It does not optimize those gains, isolate every source of failure, or predict road vehicles. Report the robot, actual settings, measured track radii, five trial outcomes and hardware limits with every conclusion.
12 // Questions people ask
Why might a robot lose a line on a tight curve?
Its sensors and controller may detect the line only after the robot has moved, and the available wheel correction may not turn the chassis quickly enough. Sensor placement, code, speed and line width also matter.
Should I tune the controller for every speed?
Not during this comparison. Keep controller gains fixed so speed and curve radius are the planned variables. A separate follow-up could compare tuning strategies after this baseline.
Can I use any speed numbers from a research paper?
No. Speed settings depend on each robot's motors, sensor arrangement, battery, track and protective limits. Use adult-approved settings for the exact classroom platform.
Is a 4-of-5 success rate reliable?
It describes only five runs. One trial changes the calculated success rate by 20 percentage points, so show raw outcomes and avoid treating the percentage as a long-term guarantee.
Does this represent a self-driving car on a road?
No. A single dark line on a flat classroom surface leaves out vehicles, road markings, lighting, weather, pedestrians, traffic rules and safety systems.
13 // Keep going
Can you explain the investigation?
How does speed affect a line-following robot on tighter curves? · Student Data Sheet
Question: As a line-following robot moves faster, how does its success rate change on curves with different measured radii?
Hypothesis: If the robot's commanded speed rises or the measured curve radius becomes tighter, then the proportion of successful laps may decrease and line-loss events may increase, because the robot has less time to sense and correct lateral error while turning, but the pattern depends on sensor geometry, controller tuning, wheel grip and the course.
Materials
- teacher-approved small line-following robot
- flat pale board or floor lane
- dark tape or approved printed track
- ruler or flexible tape measure
- stopwatch
- data table
- clear course boundary
Safety before starting
- Use only a teacher-approved small line follower at a checked low speed on a flat, clear course. Keep the robot away from edges, stairs, people traffic and fragile objects; stop a run if it leaves the marked boundary.
- Power down before moving track pieces, adjusting sensors or handling the battery. Follow the manufacturer's speed and battery instructions; do not test on public roads or use people or animals as part of the experiment.
Lab notes
- Check the manufacturer's speed, battery and operating instructions. Do not change controller settings mid-test or exceed the robot's rated limits.
Variables
Independent: Robot speed setting and curve radius · Dependent: Line-following completion and lap time
Keep constant: same robot and controller gains · same line sensor height · same line width and material · same flat track surface and lighting · same start point and lap length · randomized test order · fresh battery checks
Procedure
- Approve and bound the robot test: Use a small classroom line follower at speeds the teacher has checked on the floor. Run it on a flat tabletop or floor lane inside a clear boundary; keep hands, hair and loose items away from wheels. Stop and power down before moving tape, adjusting sensors or handling the battery. Do not use a robot near stairs, people traffic, roads or fragile equipment.
- Build three measured curve tracks: Use the same dark tape or printed line on the same flat light-colored board. Make three smooth curve sections with broad, medium and tight measured radii that fit the chosen robot; record the radius in centimeters and keep line width constant. Join each with the same straight approach and exit sections so every course has the same lap length where practical. Do not change curvature during a run.
- Choose safe speed settings and freeze the controller: With adult supervision, select three low-to-high settings that stay within the robot maker's instructions and the course boundary. Record the actual setting or measured speed; do not copy another robot's values. Verify the sensor height, reflectance threshold, controller gains, wheel condition and battery before the trials, then leave them unchanged.
- Run the 45 condition trials: Test each of the three radii at each of the three speeds, for five trials per combination. Rotate or randomize the condition order to reduce battery and learning-order effects. Start from the same mark and use one lap. Count a trial as successful only if the robot completes the lap without leaving the marked course or needing a manual reset. Record every sensor-line-loss event and its duration separately; a brief loss that recovers is useful evidence, not a reason to discard the run. Reset the robot to the same start position.
- Calculate success and compare lap time: For each radius–speed pair, calculate success percentage as successful laps ÷ 5 × 100. Keep all five trial outcomes, record lap time only for completed laps, and report the median time beside the success count. Plot success percentage against speed setting with a separate line for each measured radius; show the small denominator of five and do not imply precision beyond the trials.
- Interpret the control-system limits: Science Buddies recommends beginning with a straight line and gradual curves, and notes that sharp turns, sensor height, line width and a bumpy track can affect following. A 2026 educational PID study reports testing straight, curved and 90-degree paths on its own robot, but its tuned gains are platform-specific. Explain how this experiment differs from both sources: it varies speed and radius with one fixed robot/controller and counts repeated completions. It cannot identify the best tuning for all robots or transfer to vehicles on public roads.
Record your observations
| Curve radius (cm) | Speed setting | Trial 1 | Trial 2 | Trial 3 | Trial 4 | Trial 5 | Successes / 5 | Median lap time (s) |
|---|---|---|---|---|---|---|---|---|
Define one trial before starting
| Decision | Rule for every run |
|---|---|
Why faster and tighter may be harder
| Change | Possible effect | Other factors to keep fixed |
|---|---|---|
Formula: Success rate (%) = successful laps ÷ 5 trials × 100. A 4-of-5 result is 80% for this small sample; it is not a long-run reliability guarantee.
Answer key and expected pattern
A higher speed or tighter curve can change line-following success, but the direction and size of the effect depend on the robot and course.
One missed lap is 20 percentage points when only five trials are run, so retain individual trials and avoid overclaiming.
Sensor position, line width, reflectance, floor, battery and controller settings can alter the observed pattern.
Remember: Keep the course and robot fixed while you vary speed and curve radius. A line follower's curve limit belongs to the tested robot and setup.