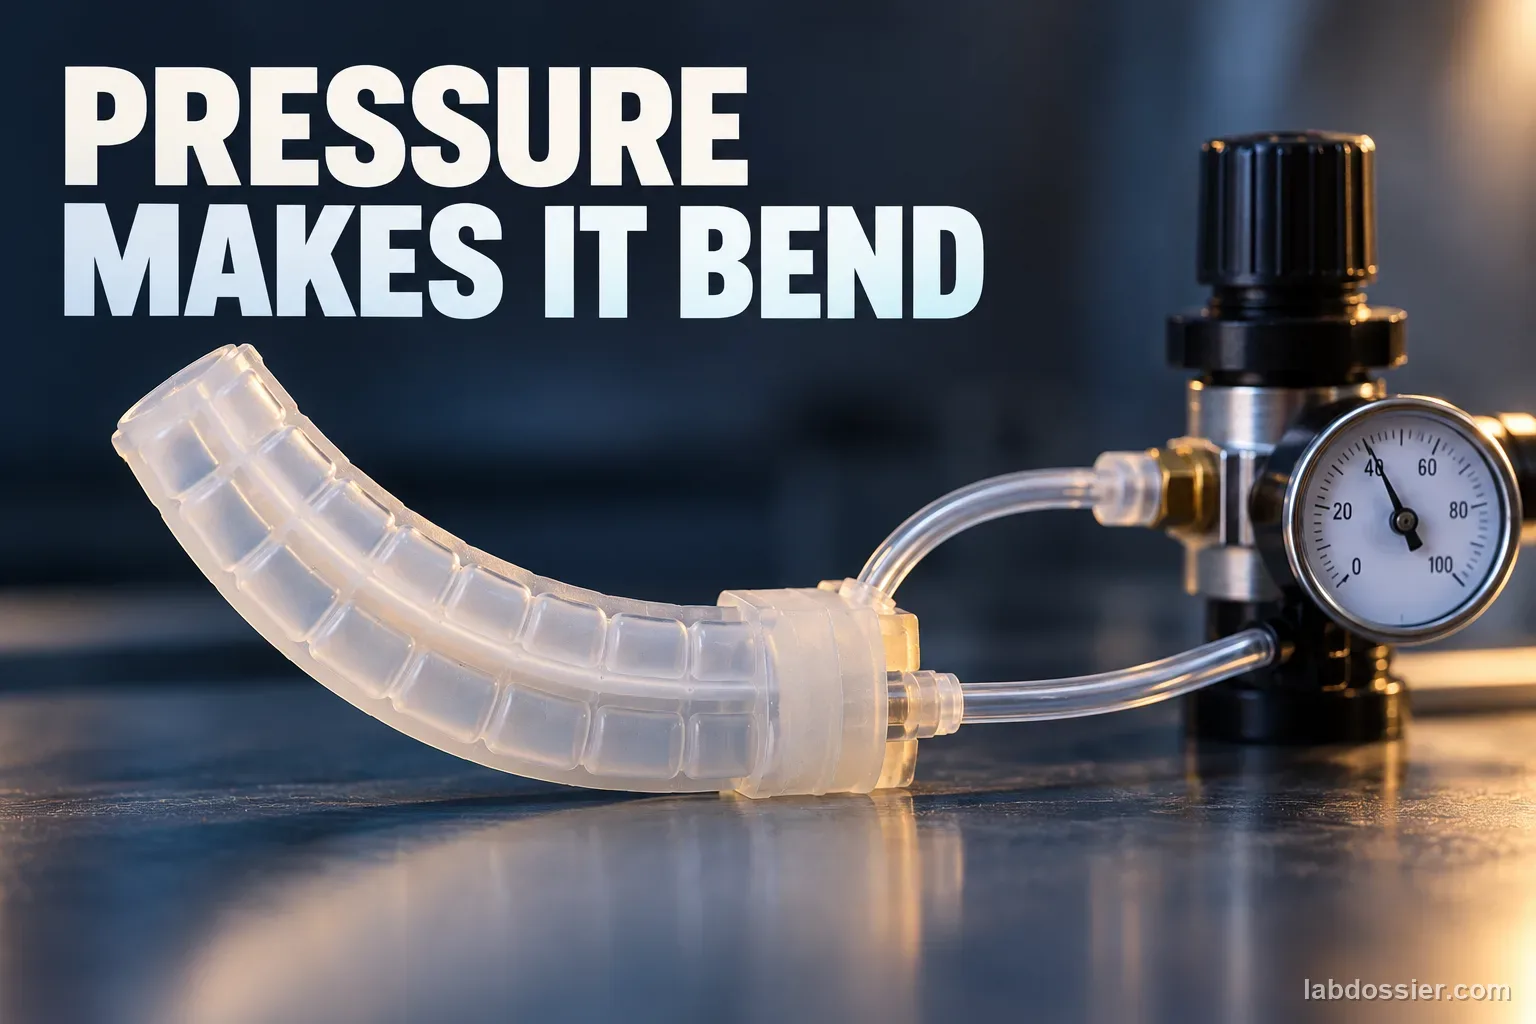
How does air pressure change the bend of a soft-robot actuator?
01 // Question
As air pressure changes, how does a soft robot actuator bend—and why can its response differ across designs or between inflation and deflation?
Use published graphs or teacher-provided graph images only. Do not make a sealed chamber, connect a syringe or pump, or copy pressure values from research equipment.
02 // Variables
Independent
Pressure level and, where reported, whether the pressure is rising or falling- Pressure as reported by each individual study
- Ascending versus descending sweep in the Frontiers characterization
- Different actuator designs as separate source categories
Dependent
The bending response reported by each study- Bending angle in degrees where the source reports angle
- Tip deflection in millimeters where the source reports displacement
- Difference between inflation and deflation response when both are shown
03 // Hypothesis
IF internal pressure rises in a particular soft pneumatic actuator, THEN its bending angle or tip deflection will often increase over the tested range, but the relationship may flatten, curve or differ on the way back down, BECAUSE pressure deforms compliant walls while geometry and reinforcement constrain where expansion becomes bending; elastomer behavior and friction can produce hysteresis.
04 // Procedure
1. Read each study as its own experiment
Use the linked Frontiers, PLOS ONE and ROBOMECH Journal papers. For each, record actuator purpose, material, chamber geometry, what the vertical and horizontal axes measure, whether points are measured or modeled, and the stated pressure range. Mark the Frontiers endoscope-scale fiber-reinforced silicone actuator, the PLOS soft quadruped leg, and the 3D-printed TPU gripper as three distinct systems.
2. Extract source-reported evidence
From the Frontiers paper, record that the three single-chamber planes reached 92.3°, 90.4° and 79.5° at 0.4 bar including its 0.05 bar preload; the reported mean hysteresis values were 3.82%, 6.70% and 2.63%. From the PLOS paper, note that its authors report zero bend at zero pressure and significant bending by 17 kPa, with angle increasing until the structure reaches its deformation limit; read approximate intermediate values only from the plotted source figure and label them graph-read estimates. From the ROBOMECH paper, its tested TPU gripper deflected about 32, 40 and 57 mm at 2, 3 and 4 bar. Keep degrees and millimeters in separate columns.
3. Build a graph without mixing units
Make separate plots for each design: pressure on the horizontal axis and that study's angle or displacement on the vertical axis. Include units in both labels, identify measured versus modeled series, and preserve the source's stated pressure reference. If the published image is the only way to obtain an intermediate value, estimate from its grid and add an approximate mark; do not present a digitized estimate as an exact table value.
4. Check for hysteresis and limits
The Frontiers study measured four ascending and descending cycles per chamber after waiting for a steady tip orientation; its authors attribute hysteresis to the elastomer and friction between the inner module and fiber reinforcement. Compare the two directions at the same plotted pressure if the source graph allows it. The pressure–bend path need not be identical on inflation and deflation, and the response may depart from a straight line near a design limit.
5. Explain why the studies cannot be ranked
The Frontiers system is a small fiber-reinforced actuator for an endoscope; the PLOS study tests a flexible quadruped leg; the ROBOMECH study uses a 3D-printed TPU gripping finger. They report different outputs, geometries, materials and pressure scales. A larger angle or deflection in one paper does not show that its actuator bends more efficiently or is safer. The ROBOMECH paper describes a compressor test bed and multi-bar settings; these are research apparatus values and must never become classroom targets.
6. Write an evidence-bounded conclusion
Name the source and prototype, summarize the trend visible in its graph, quote only a supported measurement, and state one design or measurement limitation. A good conclusion may say that pressure increased bending over the tested range for that device, while geometry, material and loading history affected the curve. Do not claim that the same pressure produces the same angle in another actuator.
Materials // Prepare the bench
- linked open-access research papers
- teacher-provided source graph images or accessible PDFs
- graph paper or spreadsheet
- colored pencils for labeling distinct studies
05 // Data table
| Study / actuator | Pressure (as reported) | Measured output | Value or source observation | Measured / modeled / graph-read | Limit to keep visible |
|---|---|---|---|---|---|
| Frontiers 2023 — fiber-reinforced silicone endoscope module | 0.4 bar incl. 0.05 bar preload | Bending angle | 92.3°, 90.4°, 79.5° for three single chambers | Measured maximums | Specific tiny geometry and chamber; not a classroom pressure setting |
| Frontiers 2023 — same device | Ascending / descending sweeps | Mean hysteresis | 3.82%, 6.70%, 2.63% for three chambers | Reported characterization | Study-defined hysteresis calculation; not transferable |
| PLOS ONE 2025 — soft quadruped leg | 0 kPa; 17 kPa; further plotted levels | Bending angle | 0° at 0 kPa; significant bend reported by 17 kPa; estimate other points from Fig. 13 | Source statement / optional graph-read estimate | No exact angle supplied in the text at 17 kPa; do not invent it |
| ROBOMECH Journal 2025 — 3D-printed TPU gripper | 2, 3, 4 bar | Tip deflection | About 32, 40, 57 mm | Reported experimental values | Different outcome (mm), design and high-pressure research rig |
Pressure-response curve: what to look for
| Graph feature | Possible interpretation | What it does not prove |
|---|---|---|
| Output rises with pressure | More pressure produced more deformation over that tested interval | A linear rule or equal response in another design |
| Curve bends or flattens | Geometry, material stiffness or a deformation limit may shape the response | The actuator is safe to pressurize further |
| Inflation and deflation traces differ | Hysteresis or time-dependent relaxation may be present | A fault, unless the study's method supports that conclusion |
| Simulation and experiment separate | Material variation, fixture effects or model assumptions may matter | That one curve is universally more accurate |
Source values must stay in their lane
| Keep separate | Example from reviewed sources |
|---|---|
| Angle and distance | Degrees in Frontiers/PLOS versus millimeters in ROBOMECH |
| Pressure scale | kPa and bar are unit-convertible, but the tested setup remains different |
| Output type | Bend angle is not tip displacement, gripping force or safety rating |
| Device identity | Endoscope actuator, quadruped leg and gripper finger are not matched prototypes |
Formula If converting pressure units for comparison only: 1 bar = 100 kPa. Keep every result labeled with its source device; unit conversion does not make the actuators comparable.
06 // What to expect
Bending or deflection usually increases over the range tested in these examples, but the source-specific curve may be nonlinear or approach a limit.
A rising-pressure and falling-pressure trace can differ; the Frontiers authors report small but measurable mean hysteresis for their own three chambers.
Results cannot be combined into one universal pressure-to-angle equation because the studies use different designs and output measures.
07 // Lab notes
08 // Remember
Pressure deforms the chamber; the actuator's design determines how that deformation becomes a bend. There is no universal pressure-to-bend curve.
09 // A pressure value is not a robot design rule
A pneumatic soft actuator bends because its flexible walls expand under internal pressure while the rest of the structure constrains that expansion. Chamber shape, wall thickness, material stiffness, fiber reinforcement, external load and how the device is held all affect how much becomes a bend. Pressure is one input to a design-specific mechanical system.
The evidence in this lesson comes from three separate research actuators. The studies report different outputs—bend angle or tip displacement—and use different pressure scales. A line fitted to one paper cannot be used to predict another actuator's angle or establish a safe operating pressure.
10 // What the three recent studies actually report
Bajohr and colleagues characterized a small fiber-reinforced silicone actuator developed for an endoscope. Their steady-state pressure sweeps went both upward and downward, used four cycles per chamber, and waited for the tip to settle before recording the next pressure. At 0.4 bar, including a 0.05 bar preload, maximum single-chamber bends were 92.3°, 90.4° and 79.5° across the three chambers. The reported mean hysteresis percentages were 3.82%, 6.70% and 2.63%.
Meng and colleagues measured a pneumatic soft quadruped leg. The paper states the angle was zero at zero pressure, that significant deformation was already visible at 17 kPa, and that angle increased until the structure reached its maximum deformation. The paper's Figure 13 is the source for any additional graph-read estimates; its text does not give an exact angle at 17 kPa, so none is invented here.
Hiremath, Mathias and Kim tested a 3D-printed TPU gripper actuator on a pneumatic test bed. Their text reports about 32, 40 and 57 mm deflection at 2, 3 and 4 bar. This is a different outcome from bend angle, and the authors describe a compressor-based setup with multi-bar pressure steps. Those research values are not student activity settings.
11 // Graph each design separately
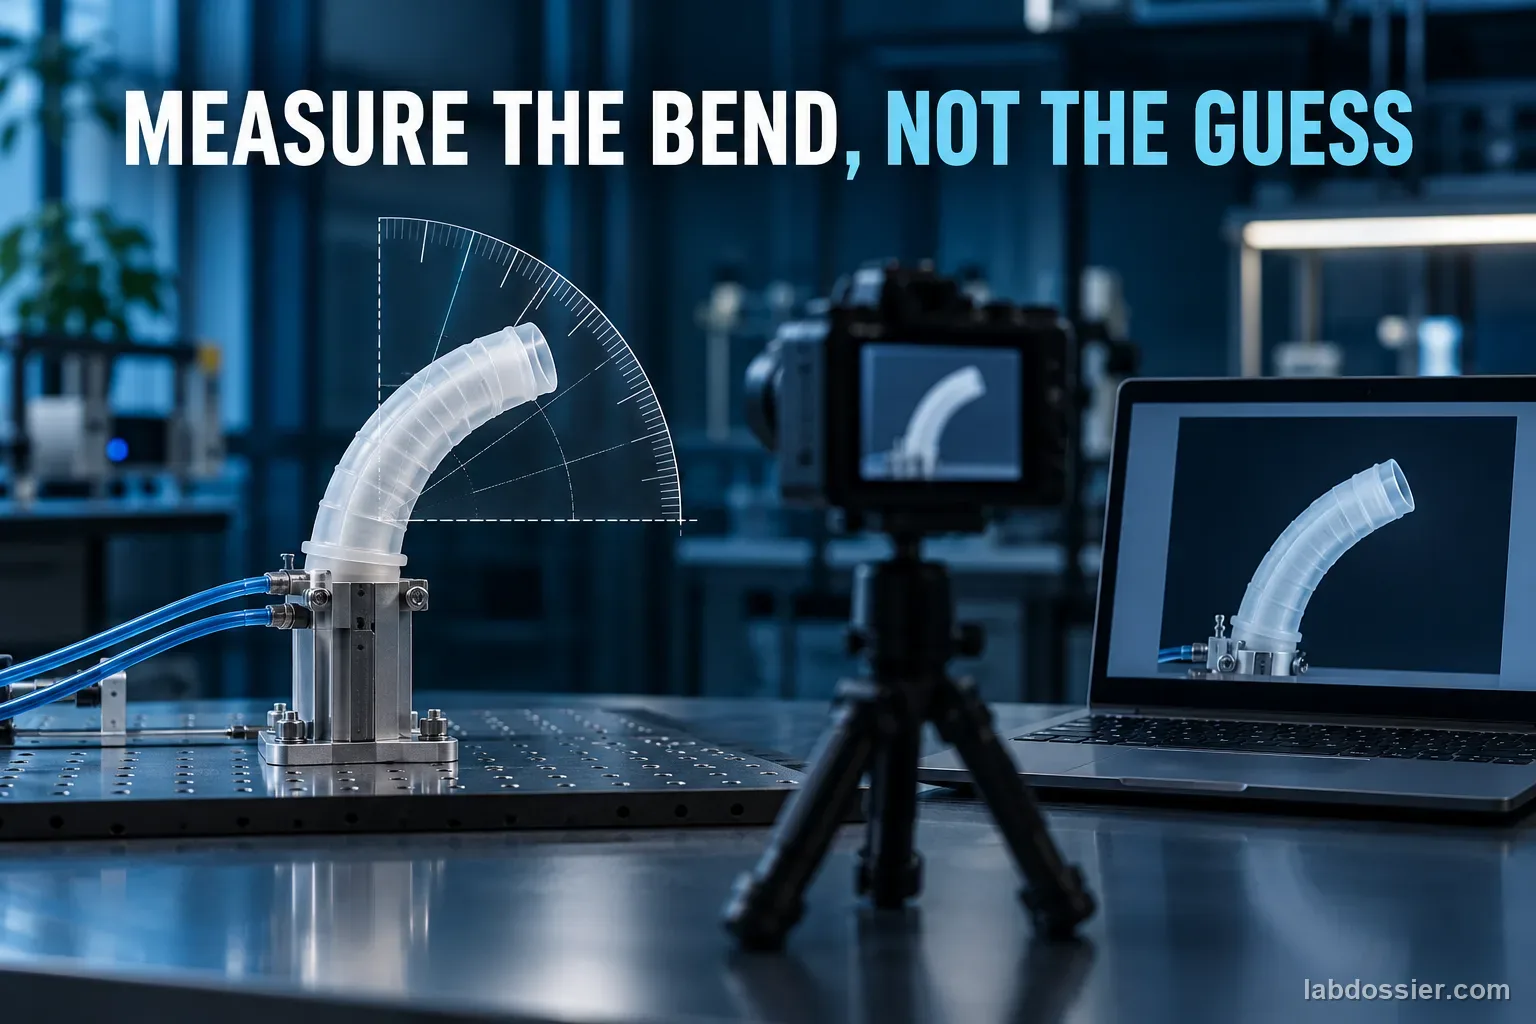
Use pressure on the horizontal axis and the output measured by that study on the vertical axis. Label angle in degrees or displacement in millimeters; never put both on one unlabeled scale. Mark results taken from text as reported values, and mark values estimated from a figure as approximate graph reads. The Frontiers article also shows measurement and finite-element-model curves; keep those series identified rather than combining them.
Where a source has both inflation and deflation traces, compare them at the same pressure and note the direction. Small gaps can come from material hysteresis, friction, relaxation, manufacturing differences or measurement resolution. The Frontiers authors attribute the effect in their design to the elastomer and friction between the silicone module and the external fiber reinforcement.
12 // Why the curves are not directly comparable
The Frontiers actuator is a small endoscope module with fiber reinforcement; the PLOS ONE paper studies a flexible leg in a soft quadruped; the ROBOMECH actuator is a 3D-printed TPU gripper. They differ in geometry, material, fixture, purpose and reported outcome. Even if bar and kilopascal are converted to the same units, the devices remain different experiments.
The safe conclusion is bounded: for these tested devices, increasing pressure increased the measured bending response over the reported range, while the curve shape and size depended on the design. The sources do not establish a universal linear pressure-to-angle law, an actuator ranking, or a pressure that is safe for a homemade chamber.

13 // Questions people ask
Does more pressure always create more bending?
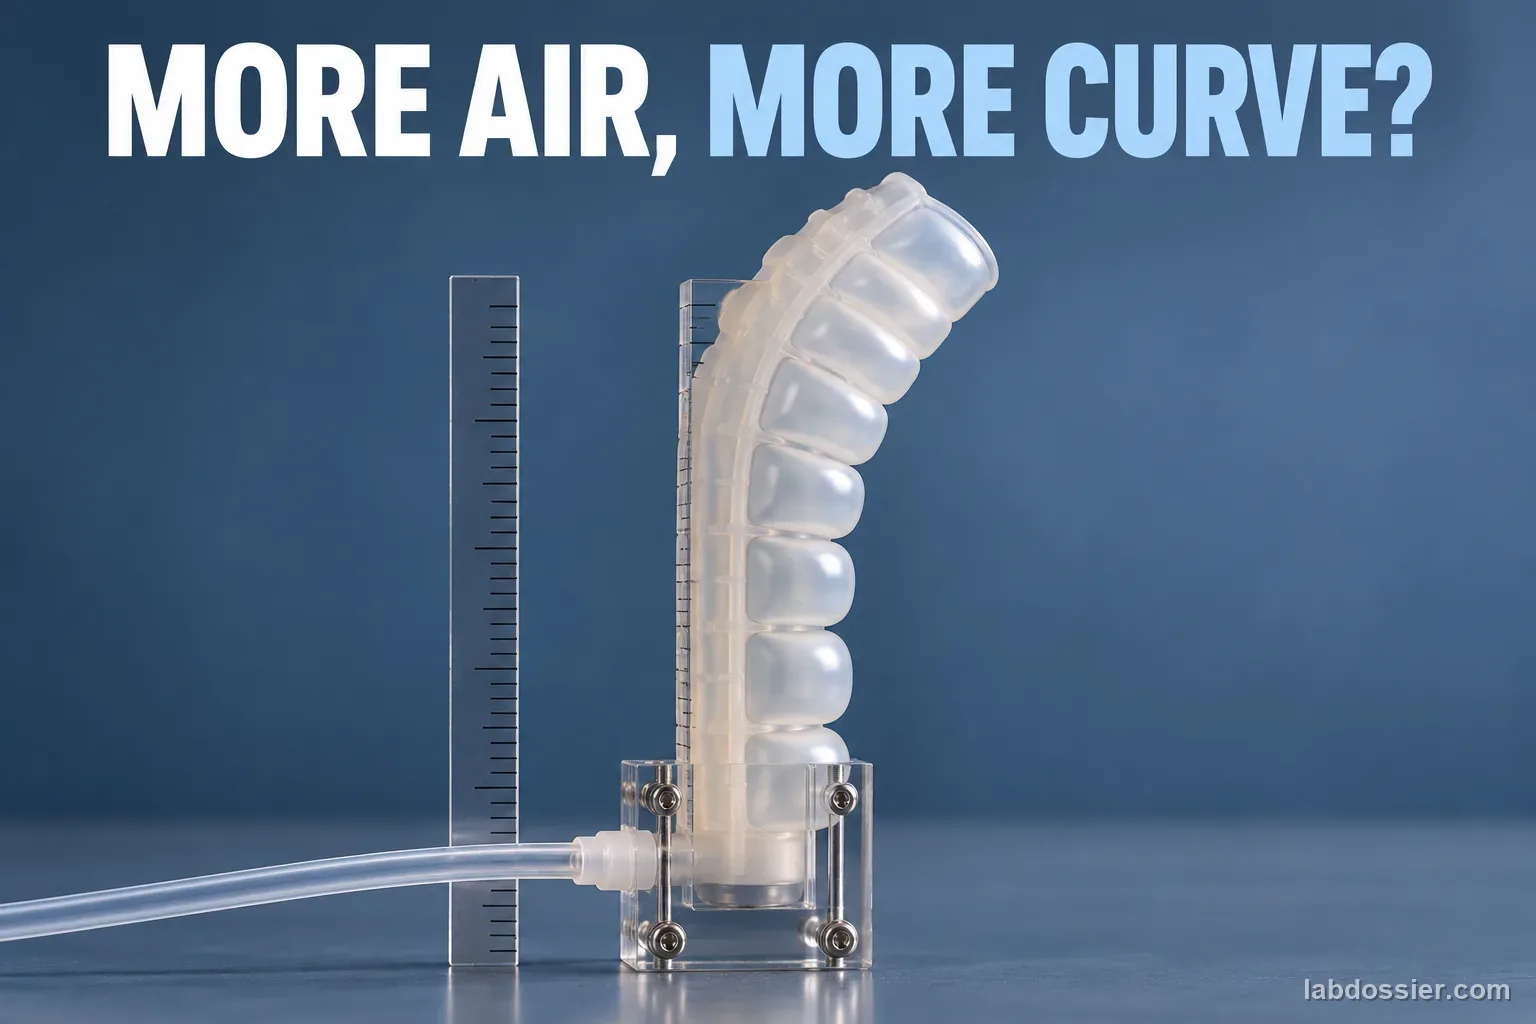
Within the tested range, these sources generally report increasing deformation as pressure rises. The shape of the curve and its limits depend on geometry, material, reinforcement, load and pressure range; do not extrapolate past the measurements.
What is hysteresis in a soft actuator?
It means the response at a given pressure can depend on whether pressure is rising or falling. The Frontiers study measured ascending and descending sweeps and linked the difference to elastomer behavior and friction between the silicone module and its fiber layer.
Can I combine all three papers into one graph?
Use separate panels or clearly separate series with their own axes and output units. Two sources report angle while the ROBOMECH paper reports tip displacement, and the actuators differ in design and purpose.
Can a student copy the 0.4-bar or multi-bar test pressure?
No. Those values belong to specific research equipment and prototypes. This activity uses published graphs; it is not a pressure-system construction or operation guide.
How can I read values that are only shown in a graph?
Estimate them from the source figure's axis grid, label each as approximate graph-read data, and record the figure and source. Do not add more decimal places than the graph supports.
14 // Keep going
Can you explain the investigation?
How does air pressure change the bend of a soft-robot actuator? · Student Data Sheet
Question: As air pressure changes, how does a soft robot actuator bend—and why can its response differ across designs or between inflation and deflation?
Hypothesis: If internal pressure rises in a particular soft pneumatic actuator, then its bending angle or tip deflection will often increase over the tested range, but the relationship may flatten, curve or differ on the way back down, because pressure deforms compliant walls while geometry and reinforcement constrain where expansion becomes bending; elastomer behavior and friction can produce hysteresis.
Materials
- linked open-access research papers
- teacher-provided source graph images or accessible PDFs
- graph paper or spreadsheet
- colored pencils for labeling distinct studies
Safety before starting
- This lesson is an analysis of open research figures. Do not make, seal, inflate, puncture, heat or load a student-built pneumatic actuator.
- Never connect syringes, balloon pumps, compressors or improvised tubing to homemade chambers. Research pressure values belong to specific test rigs and are not safe classroom targets.
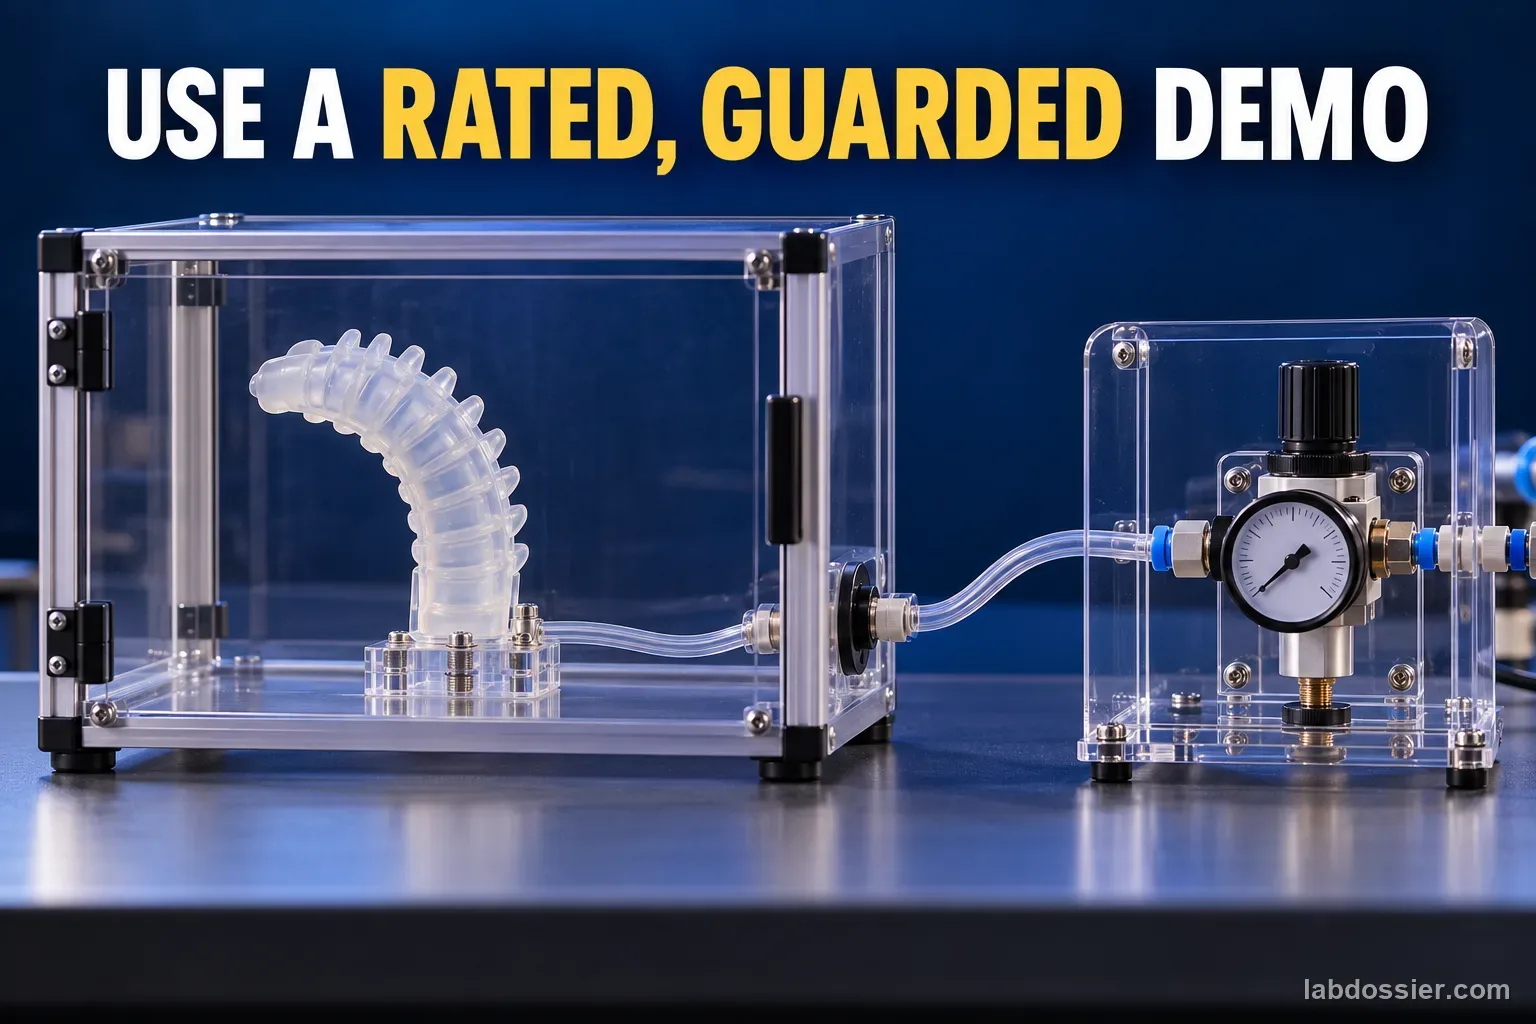
- A separate teacher demonstration requires a rated, guarded commercial system, trained supervision and a local risk review; learners stay outside its exclusion area.
Lab notes
Variables
Independent: Pressure level and, where reported, whether the pressure is rising or falling · Dependent: The bending response reported by each study
Keep constant: Keep each study's geometry, material, chamber arrangement, pressure reference, load, fixture, measurement method and unit together; never pool unlike designs into one curve
Procedure
- Read each study as its own experiment: Use the linked Frontiers, PLOS ONE and ROBOMECH Journal papers. For each, record actuator purpose, material, chamber geometry, what the vertical and horizontal axes measure, whether points are measured or modeled, and the stated pressure range. Mark the Frontiers endoscope-scale fiber-reinforced silicone actuator, the PLOS soft quadruped leg, and the 3D-printed TPU gripper as three distinct systems.
- Extract source-reported evidence: From the Frontiers paper, record that the three single-chamber planes reached 92.3°, 90.4° and 79.5° at 0.4 bar including its 0.05 bar preload; the reported mean hysteresis values were 3.82%, 6.70% and 2.63%. From the PLOS paper, note that its authors report zero bend at zero pressure and significant bending by 17 kPa, with angle increasing until the structure reaches its deformation limit; read approximate intermediate values only from the plotted source figure and label them graph-read estimates. From the ROBOMECH paper, its tested TPU gripper deflected about 32, 40 and 57 mm at 2, 3 and 4 bar. Keep degrees and millimeters in separate columns.
- Build a graph without mixing units: Make separate plots for each design: pressure on the horizontal axis and that study's angle or displacement on the vertical axis. Include units in both labels, identify measured versus modeled series, and preserve the source's stated pressure reference. If the published image is the only way to obtain an intermediate value, estimate from its grid and add an approximate mark; do not present a digitized estimate as an exact table value.
- Check for hysteresis and limits: The Frontiers study measured four ascending and descending cycles per chamber after waiting for a steady tip orientation; its authors attribute hysteresis to the elastomer and friction between the inner module and fiber reinforcement. Compare the two directions at the same plotted pressure if the source graph allows it. The pressure–bend path need not be identical on inflation and deflation, and the response may depart from a straight line near a design limit.
- Explain why the studies cannot be ranked: The Frontiers system is a small fiber-reinforced actuator for an endoscope; the PLOS study tests a flexible quadruped leg; the ROBOMECH study uses a 3D-printed TPU gripping finger. They report different outputs, geometries, materials and pressure scales. A larger angle or deflection in one paper does not show that its actuator bends more efficiently or is safer. The ROBOMECH paper describes a compressor test bed and multi-bar settings; these are research apparatus values and must never become classroom targets.
- Write an evidence-bounded conclusion: Name the source and prototype, summarize the trend visible in its graph, quote only a supported measurement, and state one design or measurement limitation. A good conclusion may say that pressure increased bending over the tested range for that device, while geometry, material and loading history affected the curve. Do not claim that the same pressure produces the same angle in another actuator.
Record your observations
| Study / actuator | Pressure (as reported) | Measured output | Value or source observation | Measured / modeled / graph-read | Limit to keep visible |
|---|---|---|---|---|---|
Pressure-response curve: what to look for
| Graph feature | Possible interpretation | What it does not prove |
|---|---|---|
Source values must stay in their lane
| Keep separate | Example from reviewed sources |
|---|---|
Formula: If converting pressure units for comparison only: 1 bar = 100 kPa. Keep every result labeled with its source device; unit conversion does not make the actuators comparable.
Answer key and expected pattern
Bending or deflection usually increases over the range tested in these examples, but the source-specific curve may be nonlinear or approach a limit.
A rising-pressure and falling-pressure trace can differ; the Frontiers authors report small but measurable mean hysteresis for their own three chambers.
Results cannot be combined into one universal pressure-to-angle equation because the studies use different designs and output measures.
Remember: Pressure deforms the chamber; the actuator's design determines how that deformation becomes a bend. There is no universal pressure-to-bend curve.