Strawberry DNA
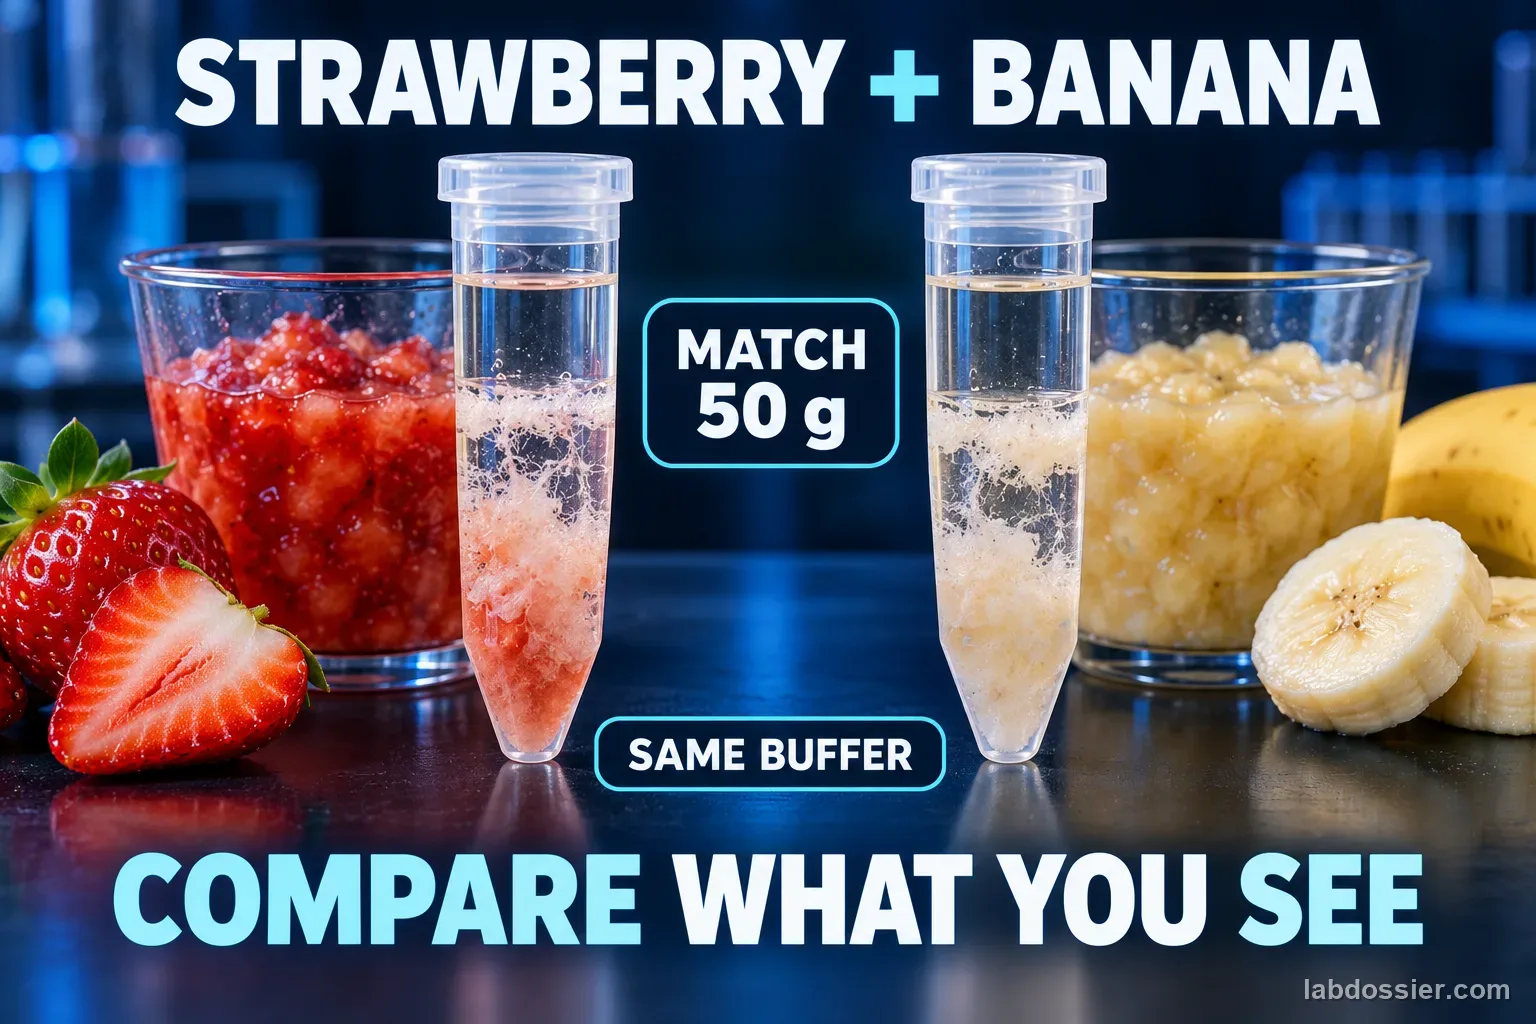
01 // Question
When equal masses of strawberry and banana are processed with the same method, how does the visible precipitate compare?
Cultivated strawberries are octoploid and many dessert bananas are triploid, but chromosome-set count alone does not predict visible yield per fruit mass.
02 // Variables
Independent
Fruit used for extraction- Strawberry · three 50 g samples
- Banana · three 50 g samples
Dependent
Visible-precipitate rating for each extraction- Shared 1–5 rating after the same 5-minute wait
- Texture and boundary location
- Median and range across three separate extractions per fruit
03 // Hypothesis
IF equal masses of strawberry and banana are processed with the same method, THEN their visible precipitate ratings may be similar or different; no direction is guaranteed, BECAUSE tissue composition, ripeness, cell density and extraction efficiency affect visible material, so chromosome-set count alone does not predict a winner.
04 // Procedure
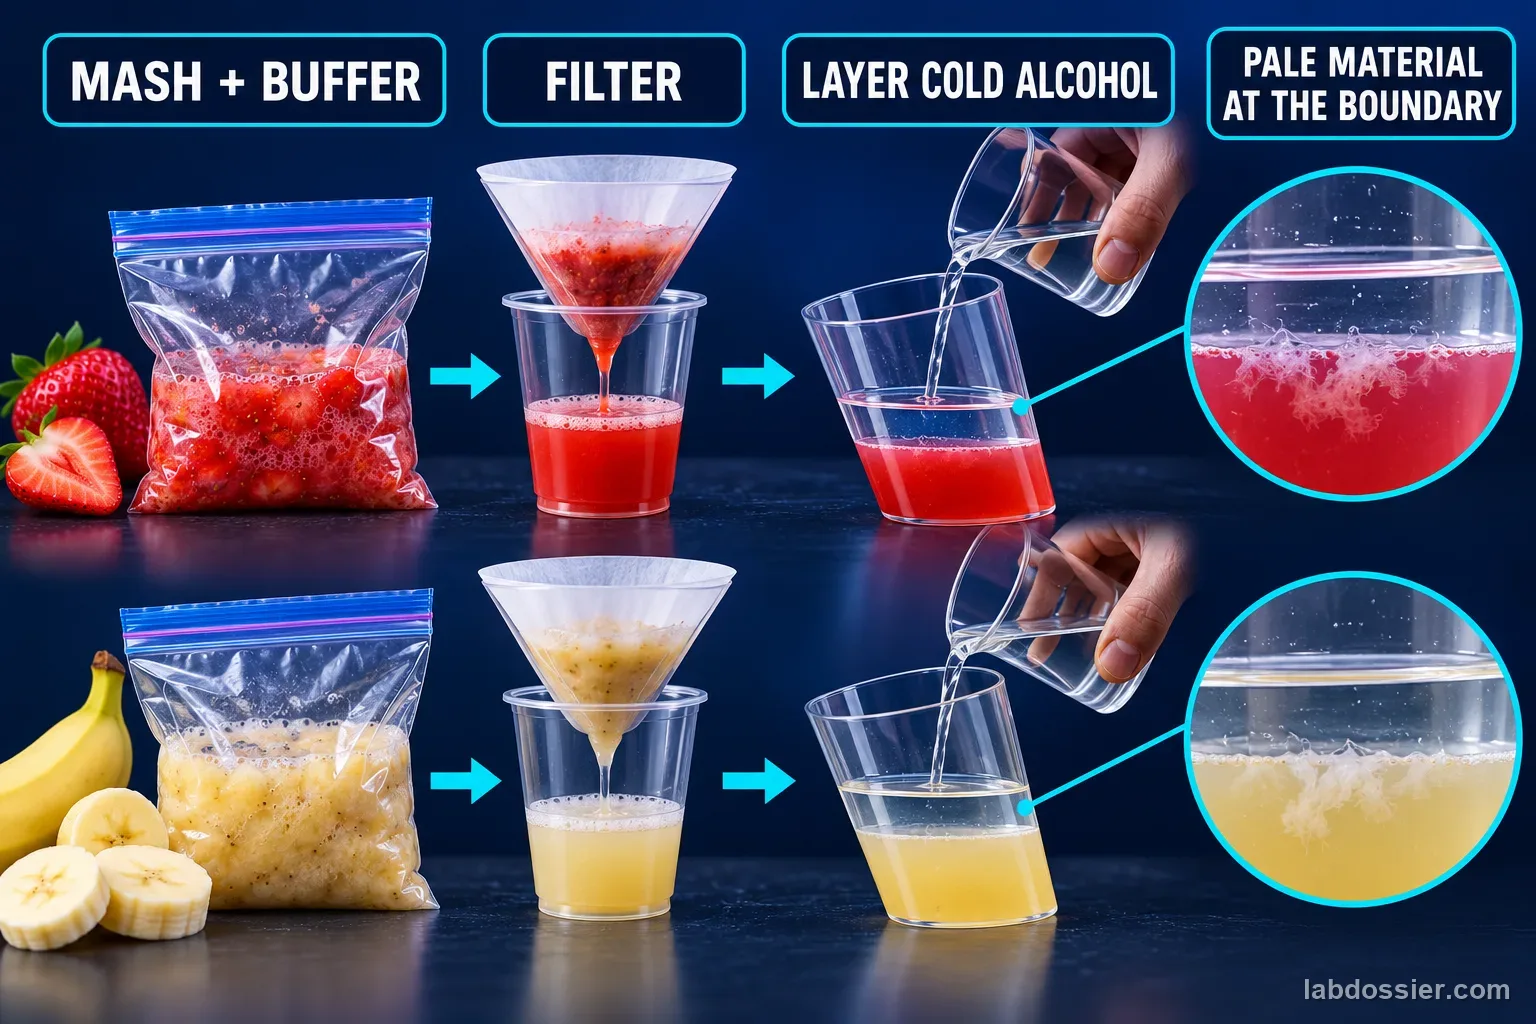
1. Prepare six matched portions
Prepare enough of the same salt-water-detergent buffer for six 30 mL portions. Label three strawberry and three banana samples; use fresh 50 g fruit for each.
2. Mash each sample separately
For all six samples, add 30 mL buffer and mash for the same 1–2 minutes. Keep fruit mass, bag and routine matched within every extraction.
3. Filter each replicate
Pass each mixture through its own fresh coffee filter into a separately labeled vessel; filtrate still contains other cell material.
4. Layer cold alcohol
An adult slowly adds 30 mL ice-cold isopropyl alcohol to each of the six tilted vessels without mixing the layers. Keep alcohol away from flames, sparks, hot plates and heat.
5. Wait the same 5 minutes
Leave all six vessels undisturbed for 5 minutes after layering, then record pale material at each extract–alcohol boundary with the same visual scale.
6. Compare replicate results
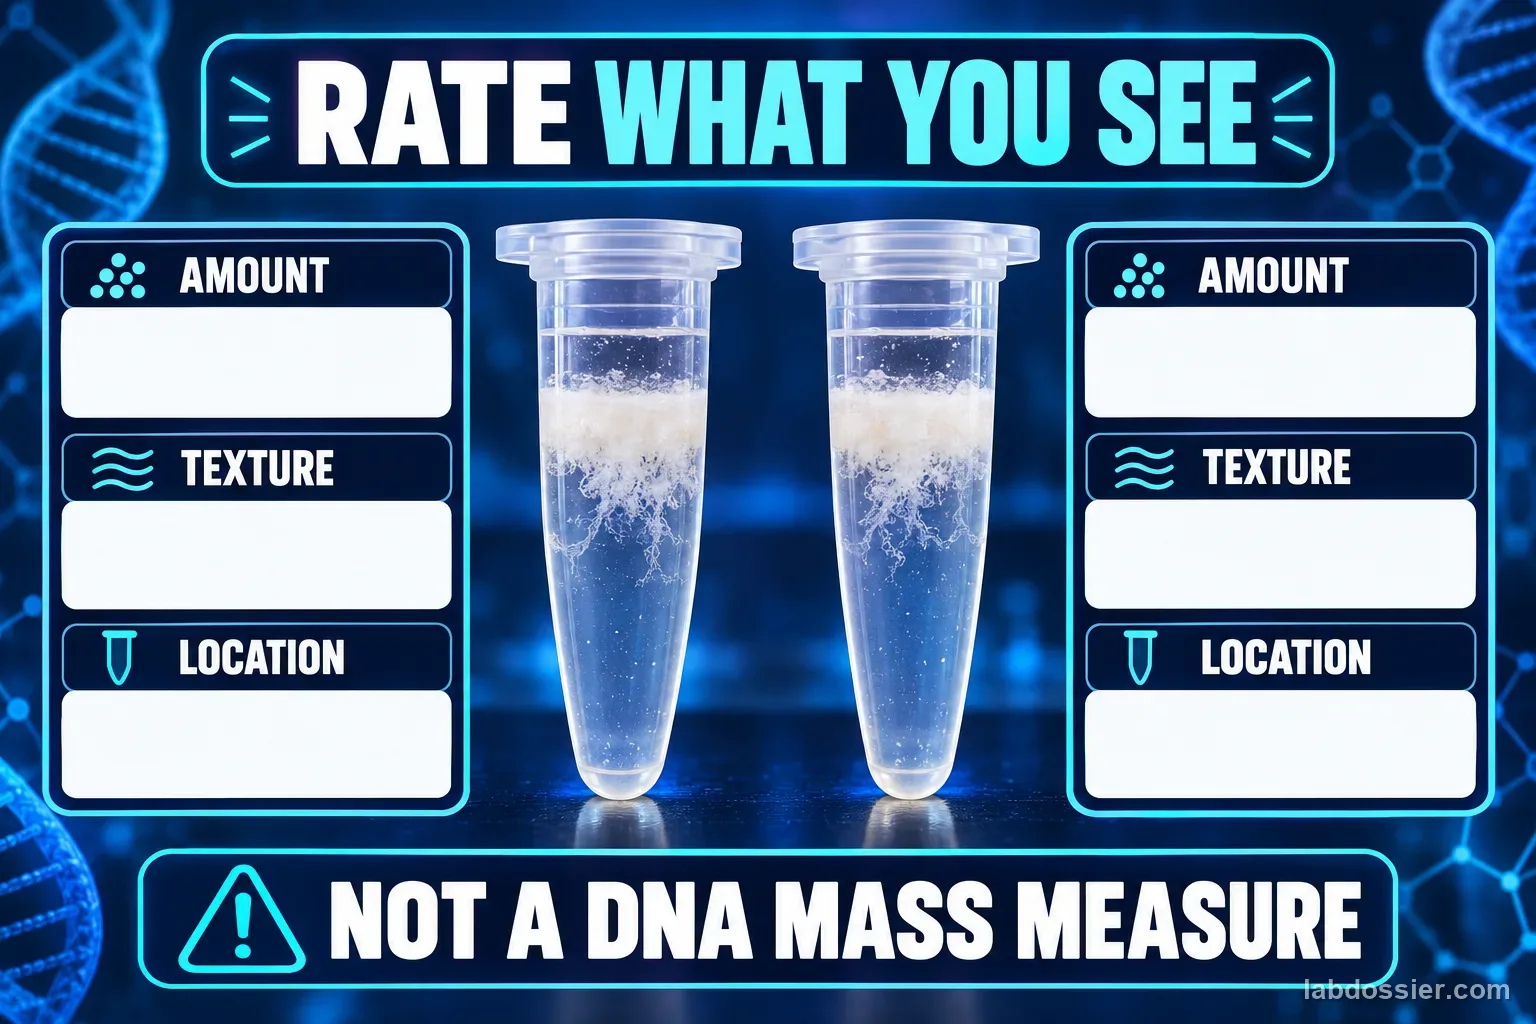
Rate each extraction 1–5 and note texture and location. Compare each fruit's three ordinal ratings using a median and range; the score spacing is not a physical measurement. The mixed precipitate is not pure DNA or a mass measurement.
Materials // Prepare the bench
- 150 g fresh strawberries and 150 g banana, divided into three 50 g samples per fruit
- balance
- 6 resealable bags
- 150 mL water
- 6 g table salt
- 30 mL dish soap
- 6 fresh coffee filters
- 6 labeled clear cups or tubes
- 180 mL ice-cold isopropyl alcohol (30 mL per sample)
- wooden sticks
- goggles
- labels and paper towels
05 // Data table
| Fruit · replicate · 50 g | Visible rating · 1–5 | Texture | Location |
|---|---|---|---|
| Strawberry · 1 | ____ | ____ | ____ |
| Strawberry · 2 | ____ | ____ | ____ |
| Strawberry · 3 | ____ | ____ | ____ |
| Banana · 1 | ____ | ____ | ____ |
| Banana · 2 | ____ | ____ | ____ |
| Banana · 3 | ____ | ____ | ____ |
Summarize the three independent ratings
| Fruit | Median rating | Range |
|---|---|---|
| Strawberry | ____ | ____ |
| Banana | ____ | ____ |
06 // What to expect
Compare the three separate extraction ratings for each fruit using their median and range. The 1–5 scale is ordinal, so treat these as descriptive summaries, not precise amounts. Do not assume the direction in advance from chromosome-set count. Cultivated strawberries are octoploid, while many dessert bananas are triploid, but ploidy alone does not determine DNA recovered per gram of fruit. Genome size, cell density, tissue composition, ripeness, and extraction efficiency also matter. The pale precipitate is a mixture of cellular material, so its apparent thickness is only a rough visual observation, not a measurement of DNA mass or purity.
The detergent helps disrupt cell and nuclear membranes, while salt supports the precipitation of DNA-containing material when cold alcohol is added. Filtering removes many large pulp pieces, but the visible precipitate is still a mixture, not purified DNA.
07 // Lab notes
- Keep the six extractions separate from start to finish. Three fruit portions from the same class setup are method replicates; they do not represent different strawberry or banana varieties.
- Chill the rubbing alcohol in a freezer for at least 30 minutes before the lab — colder alcohol makes DNA clump and become visible faster.
- Pour the alcohol slowly down the tilted side of the tube so it forms a clean layer instead of mixing in.
08 // Remember
Ploidy alone does not predict visible extraction yield. Control fruit mass and method, then compare the evidence.
09 // Prepare a matched extraction buffer
For six samples, gently stir 150 mL water, 6 g table salt and 30 mL dish soap into one buffer. Measure 30 mL into each of six labeled samples. Use the same batch so the buffer recipe cannot explain a difference among fruits or replicates.
Weigh three separate 50 g strawberry portions and three separate 50 g banana portions. Mash each in its own resealable bag for the same 1–2 minutes, then filter through a fresh coffee filter into one of six labeled cups. Record any torn filter, spill or large amount of pulp that passes through, because those differences can change the appearance of a sample.
10 // What each extraction step contributes
Mashing breaks apart strawberry tissue and increases the number of cells exposed to the extraction solution. Dish soap disrupts cell and nuclear membranes, releasing cell contents. Salt helps DNA molecules clump together under the extraction conditions. Filtering removes many large pieces of fruit tissue, while cold alcohol forms a separate layer in which DNA is less soluble and DNA-containing material may become visible as pale strands or clumps.
Use cold alcohol and pour it slowly down the cup wall so it forms a layer instead of mixing immediately with the strawberry liquid. The visible material is not a single pure DNA strand; it is a mixture that can include DNA and other cellular substances. This classroom extraction shows that biological material can be isolated, but it does not reveal the double-helix structure directly.
11 // Collect observations that can be compared
For the fruit comparison, add 30 mL of the same ice-cold isopropyl alcohol to each of the six filtrates by slowly pouring it down the tilted cup wall. Do not stir. Wait five minutes after layering before rating the samples. Use the same 1–5 visual scale and describe texture and location; a photo taken from the same angle and lighting can help preserve each observation.
Use one shared appearance scale for all six samples: 1 = no pale material visible; 2 = a few faint flecks; 3 = several visible strands or a small clump; 4 = a clear clump or strand layer; 5 = abundant connected material. Rate only what is visible at the boundary, then record texture and location separately. Calculate each fruit's mean and range from its three separate extractions. This ordinal scale does not measure DNA mass.
Keep the three samples of each fruit separate throughout extraction. These are method replicates that show how consistent the procedure was for the selected fruit samples; they do not represent different cultivars or prove a universal species-level difference. Retain all six ratings and describe unusual filtering, spills or mixed layers before interpreting the averages.
If testing a variable such as soap concentration or mashing time, use strawberries of similar mass and keep the amount of salt solution, filter type, alcohol volume, and temperature the same. Record the time until visible strands appear and estimate the amount using a consistent scale or photo method. One cup may look cloudier simply because more pulp passed through the filter; distinguish cloudiness from the stringy material gathered at the alcohol boundary.
Use a control that leaves out one extraction ingredient only if the class can interpret what the missing ingredient is expected to do. For example, a no-soap mixture may release less cellular material, but it may also differ in texture and filtration. Controls clarify a particular step; they do not make an experiment perfectly pure. Label each sample and record any spills, mixing, or filter tears that could change the result.
12 // Handle alcohol and samples safely
Isopropyl alcohol is flammable and should be kept away from flames, hot plates, sparks, and heat sources. The teacher should control dispensing and follow the alcohol label and school rules. Wear goggles, avoid splashing, do not taste any sample, and wash hands after handling fruit and lab mixtures. Use clean strawberries and equipment, then discard the mixture according to classroom instructions rather than pouring alcohol-containing waste near a flame or drain without checking policy.
If DNA is not visible, check that the alcohol was cold, added slowly, and not stirred into the aqueous layer. Mash the fruit thoroughly and make sure the filter is not clogged or bypassed. Repeat with the same fruit mass and measure each liquid rather than estimating by eye. A follow-up could compare fruit types or ripeness, but use equal starting mass and the same extraction steps before attributing a difference to the sample.
13 // Work with the rating scale honestly
Suppose three strawberry extracts receive ratings of 2, 3, and 4, while three banana extracts receive 3, 4, and 5. The medians are 3 and 4; the ranges are both 2. Those example scores describe a one-step difference on this chosen ordinal scale. They do not show that one sample contained a measured amount more DNA, and the values are practice data rather than a promised outcome.
Before looking at the tubes, agree on what each rating means. For example, rate the visible precipitate by a shared reference card and record texture and location separately. If classmates disagree, keep both observations or discuss the rubric before rescoring. The precipitate contains DNA along with other cell material; this classroom appearance test cannot establish DNA purity, mass, or which fruit has a universal higher yield.
14 // Treat the comparison as a controlled classroom model
Keep fruit mass, buffer volume, mash time, filter type, alcohol volume, wait time, and vessel shape the same for all six extracts. Use a fresh filter and clean labeled container for each replicate. Record fruit variety and ripeness because those conditions can affect tissue breakdown and the visible result. A different recipe or a new fruit batch should be reported as a new comparison rather than quietly combined with the first set.
An adult should handle the isopropyl alcohol, keep it closed when not in use, and keep it away from flame, sparks, hot plates, and heat. Do not taste the materials or store the precipitate as food. Follow the teacher's local disposal directions and wash hands after the activity.
15 // Keep extraction comparisons fair
If comparing detergent amount, keep strawberry mass, salt solution volume, mashing time, and alcohol volume constant. Filter each mixture in the same way before adding alcohol and use the same wait before observing the precipitate. A thicker-looking layer may reflect different mixing or filtering rather than a change in DNA yield.
For a fruit comparison, prepare three separate 50 g extracts of each fruit. Keep the six bags, buffer portions, mash times, filters, vessels, and alcohol layers separate. Score all six with the same 1–5 scale, then compare each fruit's median and range. The ordinal ratings describe visible patterns, not a precise DNA amount or a universal difference between fruit types.
Record the precipitate's color, texture, and location under consistent photo conditions. The classroom activity demonstrates extraction from cells; it does not provide a genetic test or identify traits from visible material.
16 // Questions people ask
Why are strawberries commonly used for DNA extraction?
They are soft and easy to mash, and their tissue releases visible precipitate with a simple classroom method. Cultivated strawberries are octoploid, but that fact alone does not prove that an equal mass will yield more DNA than banana; genome size, tissue composition, and extraction efficiency also matter.
What does the dish soap do in the extraction buffer?
Detergent helps disrupt cell and nuclear membranes, releasing cell contents into the liquid. Filtering catches large pulp pieces but does not purify DNA.
Why layer cold alcohol slowly?
Cold alcohol makes DNA-containing material less soluble. A slow layer leaves a visible boundary where material may collect; the pale mixture is not pure DNA.
17 // Keep going
Can you explain the investigation?
Strawberry DNA · Student Data Sheet
Question: When equal masses of strawberry and banana are processed with the same method, how does the visible precipitate compare?
Hypothesis: If equal masses of strawberry and banana are processed with the same method, then their visible precipitate ratings may be similar or different; no direction is guaranteed, because tissue composition, ripeness, cell density and extraction efficiency affect visible material, so chromosome-set count alone does not predict a winner.
Materials
- 150 g fresh strawberries and 150 g banana, divided into three 50 g samples per fruit
- balance
- 6 resealable bags
- 150 mL water
- 6 g table salt
- 30 mL dish soap
- 6 fresh coffee filters
- 6 labeled clear cups or tubes
- 180 mL ice-cold isopropyl alcohol (30 mL per sample)
- wooden sticks
- goggles
- labels and paper towels
Safety before starting
- Rubbing alcohol is flammable. Keep it away from flames, sparks, hot plates, and other heat sources; have an adult handle the alcohol and any chilled container.
- Wear splash goggles, do not taste any sample, and never pipette by mouth. If alcohol gets into eyes, rinse with clean water and alert the supervising adult.
Lab notes
- Keep the six extractions separate from start to finish. Three fruit portions from the same class setup are method replicates; they do not represent different strawberry or banana varieties.
- Chill the rubbing alcohol in a freezer for at least 30 minutes before the lab — colder alcohol makes DNA clump and become visible faster.
- Pour the alcohol slowly down the tilted side of the tube so it forms a clean layer instead of mixing in.
Variables
Independent: Fruit used for extraction · Dependent: Visible-precipitate rating for each extraction
Keep constant: 50 g per sample · 30 mL of the same buffer · same 1–2 minute mash · fresh filter · 30 mL cold alcohol · same vessels and 5-minute observation time
Procedure
- Prepare six matched portions: Prepare enough of the same salt-water-detergent buffer for six 30 mL portions. Label three strawberry and three banana samples; use fresh 50 g fruit for each.
- Mash each sample separately: For all six samples, add 30 mL buffer and mash for the same 1–2 minutes. Keep fruit mass, bag and routine matched within every extraction.
- Filter each replicate: Pass each mixture through its own fresh coffee filter into a separately labeled vessel; filtrate still contains other cell material.
- Layer cold alcohol: An adult slowly adds 30 mL ice-cold isopropyl alcohol to each of the six tilted vessels without mixing the layers. Keep alcohol away from flames, sparks, hot plates and heat.
- Wait the same 5 minutes: Leave all six vessels undisturbed for 5 minutes after layering, then record pale material at each extract–alcohol boundary with the same visual scale.
- Compare replicate results: Rate each extraction 1–5 and note texture and location. Compare each fruit's three ordinal ratings using a median and range; the score spacing is not a physical measurement. The mixed precipitate is not pure DNA or a mass measurement.
Record your observations
| Fruit · replicate · 50 g | Visible rating · 1–5 | Texture | Location |
|---|---|---|---|
Summarize the three independent ratings
| Fruit | Median rating | Range |
|---|---|---|
Answer key and expected pattern
Compare the three separate extraction ratings for each fruit using their median and range. The 1–5 scale is ordinal, so treat these as descriptive summaries, not precise amounts. Do not assume the direction in advance from chromosome-set count. Cultivated strawberries are octoploid, while many dessert bananas are triploid, but ploidy alone does not determine DNA recovered per gram of fruit. Genome size, cell density, tissue composition, ripeness, and extraction efficiency also matter. The pale precipitate is a mixture of cellular material, so its apparent thickness is only a rough visual observation, not a measurement of DNA mass or purity.
The detergent helps disrupt cell and nuclear membranes, while salt supports the precipitation of DNA-containing material when cold alcohol is added. Filtering removes many large pulp pieces, but the visible precipitate is still a mixture, not purified DNA.
Remember: Ploidy alone does not predict visible extraction yield. Control fruit mass and method, then compare the evidence.