LF-06 · TEACHER LESSON PLAN
Strawberry DNA
Compare visible precipitate from equal-mass strawberry and banana samples
Driving question
Learning objectives
- Students predict whether equal-mass strawberry and banana samples will show similar or different visible precipitate without naming a guaranteed winner.
- Students investigate three separate 50 g extracts per fruit using matched buffer, mash, filtration and cold-alcohol steps.
- Students classify each of the six precipitates with a shared 1–5 scale, describe texture and boundary location, and compare fruit-level medians and ranges.
- Students explain how mashing, detergent, salt, filtering and cold alcohol help reveal DNA-containing cell material.
Standards
| Dimension | Alignment |
|---|---|
| Performance expectation | HS-LS1-1Construct an explanation based on evidence for how the structure of DNA determines the structure of proteins which carry out the essential functions of life through systems of specialized cells. (Partial alignment only: DNA extraction shows that DNA is physically present in cells; it does not show how DNA structure determines protein structure. Use as background context for older students.) |
| Practices | SEP 3Plan and carry out investigations. SEP 4Analyze and interpret data. |
| Core idea | LS1.A / LS3.A backgroundAll cells contain genetic information in the form of DNA molecules. |
| Crosscutting | Structure and functionComplex and microscopic structures and systems can be visualized, modeled, and used to describe how their function depends on the relationships among its parts. |
Standards text paraphrased from nextgenscience.org. Alignment is partial; this hands-on activity does not cover every part of the performance expectation.
State standards crosswalk
Use the row as a planning crosswalk, then confirm local district pacing and grade placement. “Partial” labels describe a skill connection, not full mastery of the complete standard.
| State | Verified standard | How this lesson aligns | Official source |
|---|---|---|---|
| California | CA NGSS HS-LS3-1 | Limited. The extraction shows DNA-containing material, but students do not ask how DNA and chromosomes code traits or use a model to connect them. | Open standard ↗ |
| Texas | BIO.7(A) | Limited. This activity makes DNA-containing cell material visible but does not identify DNA components, interpret nucleotide sequence, or investigate DNA origin. | Open standard ↗ |
| Florida | SC.912.L.16.11 | Limited. The extraction is a simple classroom demonstration; students do not analyze forensic identification technologies or restriction fragment patterns. | Open standard ↗ |
| New York | MS-LS3-1 | Limited. Visible precipitate does not model how a gene mutation may change a protein or affect an organism. | Open standard ↗ |
| Pennsylvania | 3.1.9-12.P | Limited. Students observe DNA-containing material, but do not question how DNA and chromosomes code inherited traits. | Open standard ↗ |
Materials and prep timeline
PER GROUP
- 150 g fresh strawberry and 150 g banana, divided into three separate 50 g samples per fruit
- 6 resealable bags; mix 150 mL water, 6 g salt and 30 mL dish soap for six 30 mL buffer portions
- 6 coffee filters, 6 clear cups or tubes, 6 labels and wooden sticks
- 180 mL ice-cold isopropyl alcohol, adult-dispensed as 30 mL per sample
- Balance, measuring cylinder, goggles and paper towels
TEACHER ONLY
- Chill rubbing alcohol in a freezer for at least 30 minutes before class
- Keep the alcohol away from flames, sparks and heat; supervise dispensing and disposal
- Mix enough buffer for six separate samples; provide one printed student sheet per student
CLASS-SIZE KIT PLANNER
One per-group kit contains every item in the team materials list above. Groups are balanced around the listed 3–4 students target.
| Students | Groups | Per-group kits | Student sheets | Suggested group split |
|---|---|---|---|---|
| 20 | 6 | 6 complete kits | 20 copies | 2 groups of 4 and 4 groups of 3 |
| 25 | 7 | 7 complete kits | 25 copies | 4 groups of 4 and 3 groups of 3 |
| 30 | 8 | 8 complete kits | 30 copies | 6 groups of 4 and 2 groups of 3 |
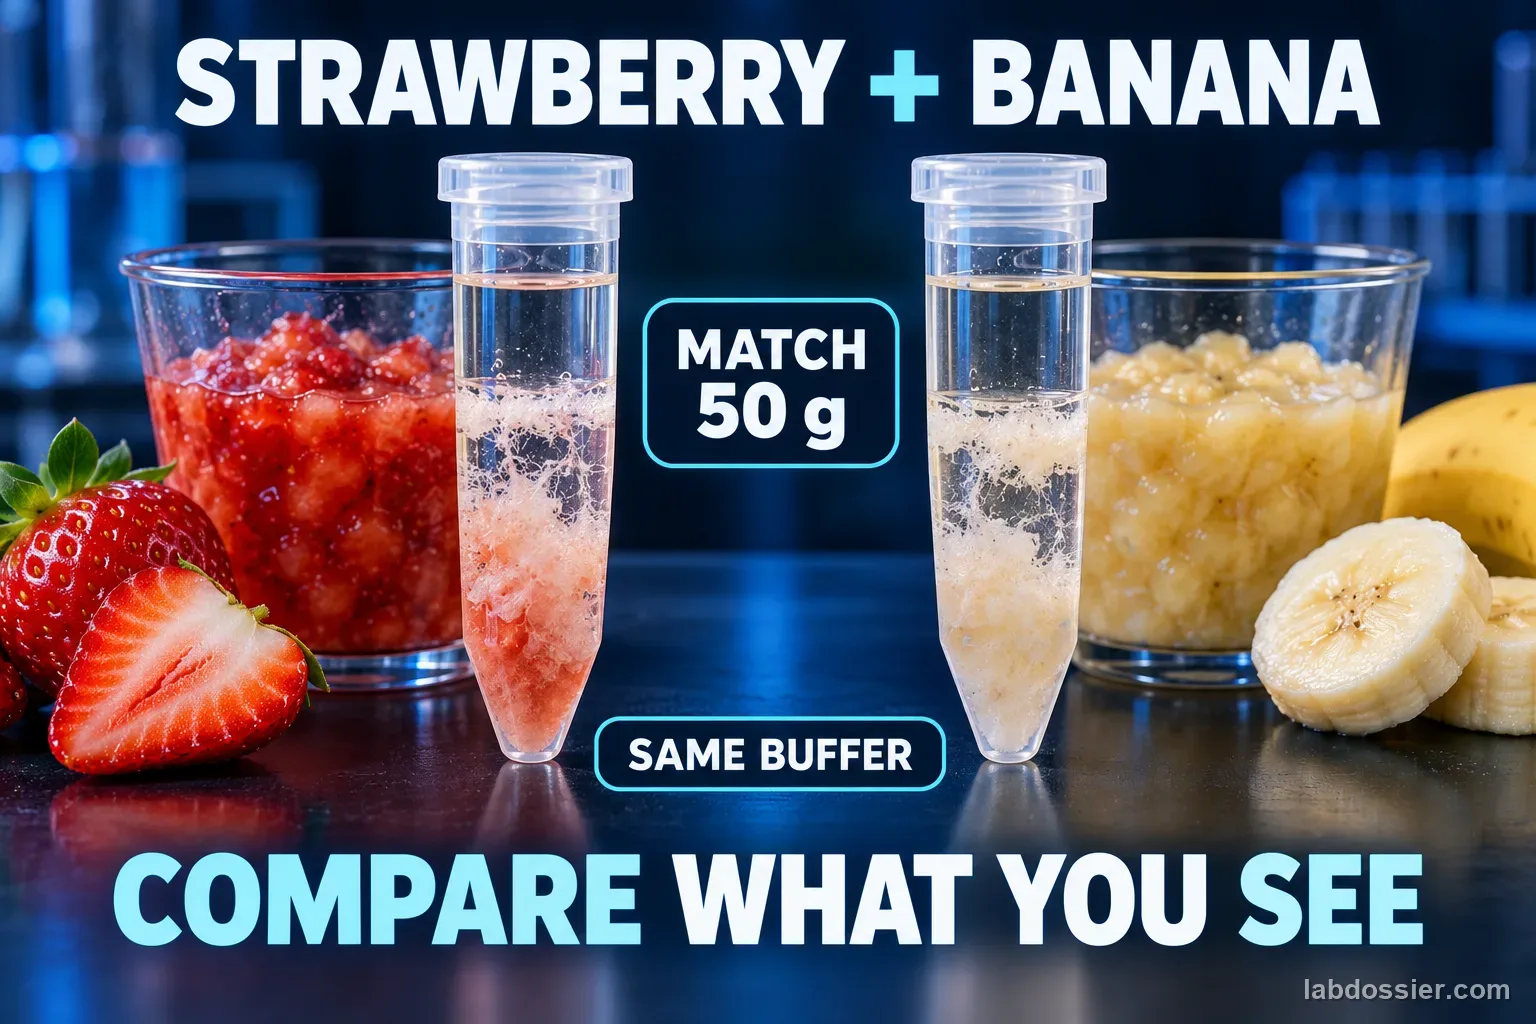
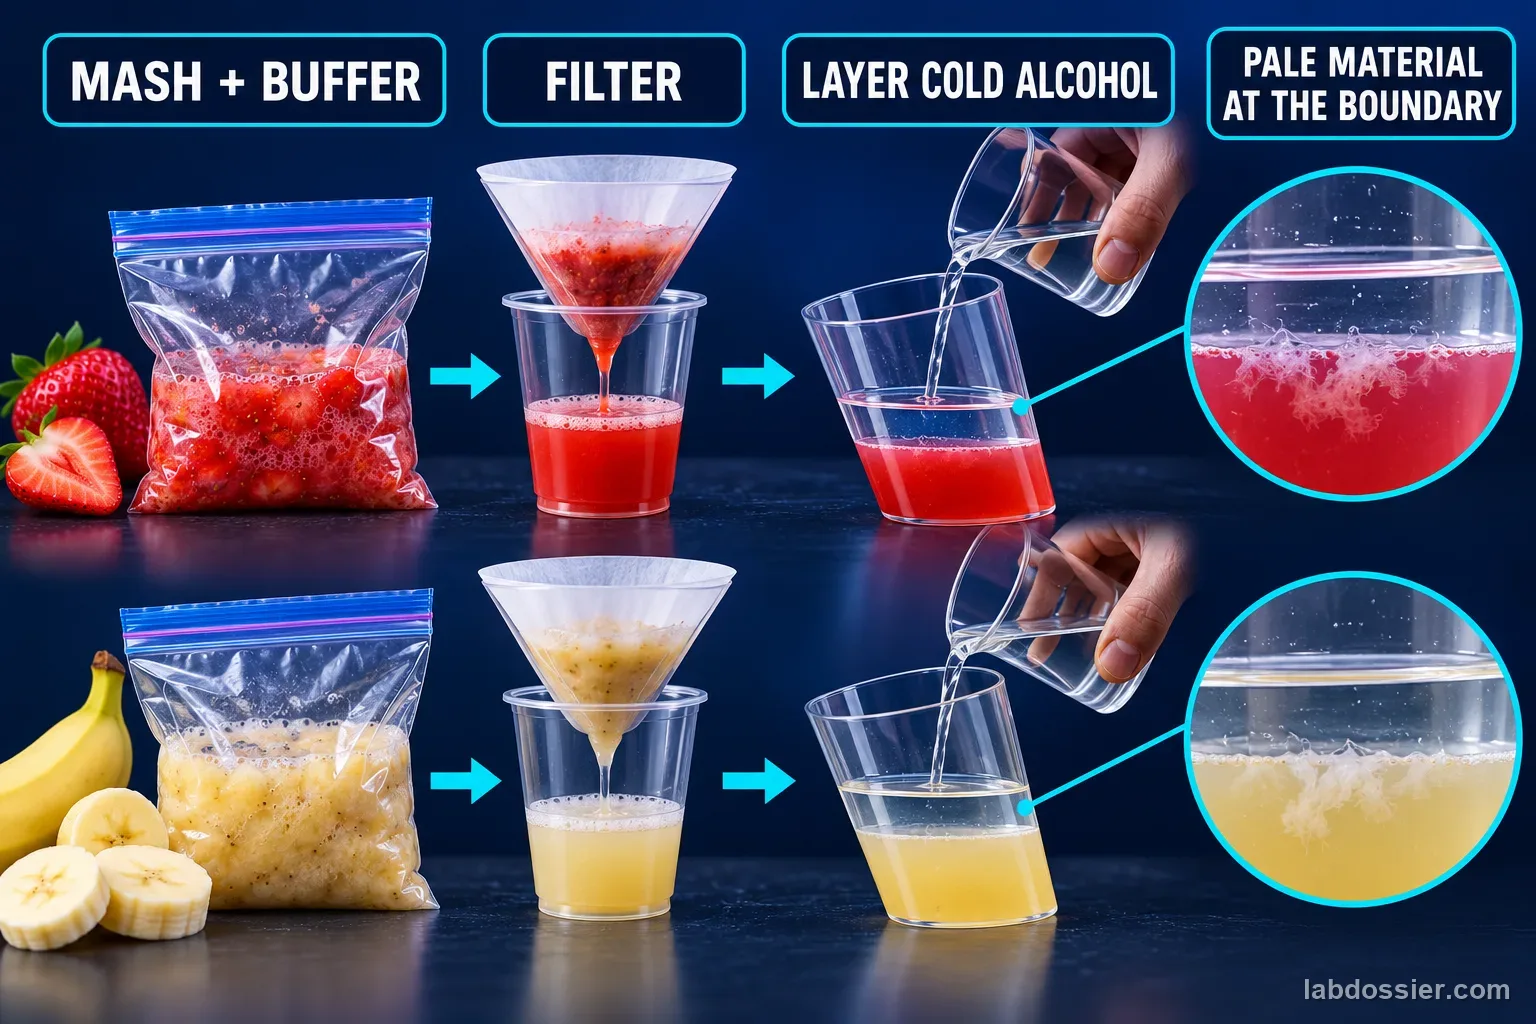
Make three separate 50 g strawberry samples and three banana samples. Give each the same buffer volume and mash time, filter into fresh labeled vessels, then have an adult layer the same cold-alcohol volume.
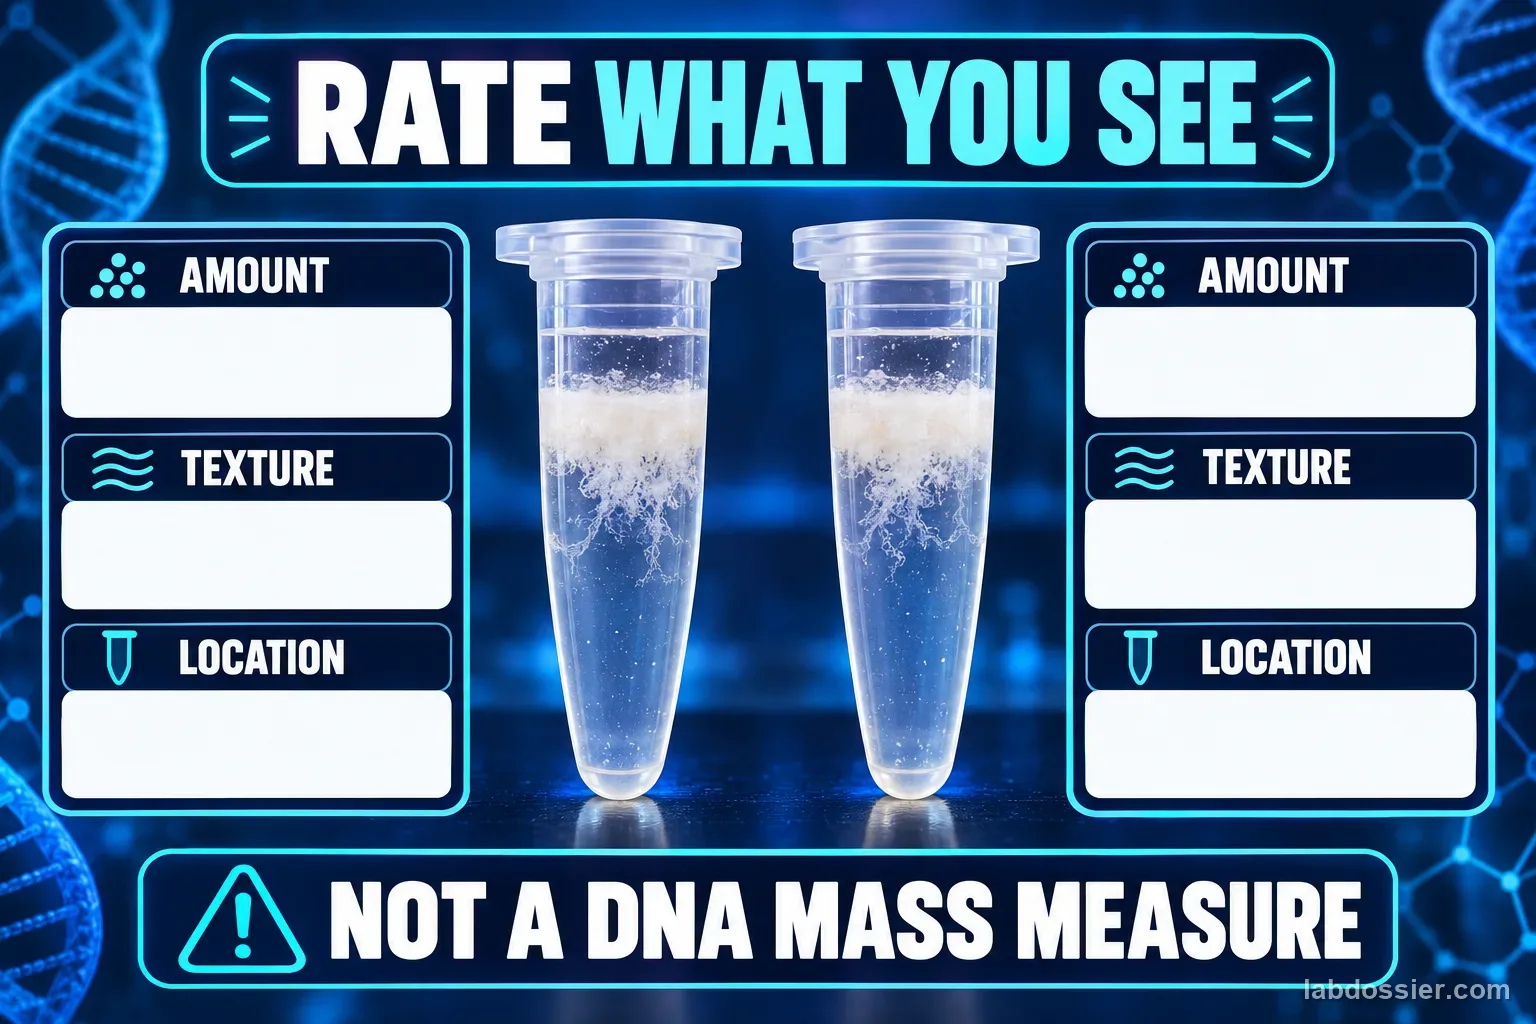
After the same five-minute wait, record six ratings plus texture and location. Calculate each fruit's median and range, then explain what cloudy strands do and do not show.
Lab figures and data visuals
Reviewed article images support the lesson flow. Use the tables and student sheet to record actual observations; pictured patterns are not target results.
Printable shopping list
Shopping and staging checklist
Multiply the per-group kit contents by the class-size planner. The teacher section includes teacher-provided materials and setup or safety notes.
PER-GROUP KITS
- 150 g fresh strawberry and 150 g banana, divided into three separate 50 g samples per fruit
- 6 resealable bags; mix 150 mL water, 6 g salt and 30 mL dish soap for six 30 mL buffer portions
- 6 coffee filters, 6 clear cups or tubes, 6 labels and wooden sticks
- 180 mL ice-cold isopropyl alcohol, adult-dispensed as 30 mL per sample
- Balance, measuring cylinder, goggles and paper towels
TEACHER-PROVIDED MATERIALS + SETUP RULES
- Chill rubbing alcohol in a freezer for at least 30 minutes before class
- Keep the alcohol away from flames, sparks and heat; supervise dispensing and disposal
- Mix enough buffer for six separate samples; provide one printed student sheet per student
QUANTITIES BY CLASS SIZE
| Material | Per group kit | 20 students | 25 students | 30 students |
|---|---|---|---|---|
| Fresh strawberries | 50 g | 300 g | 350 g | 400 g |
| Banana | 50 g | 300 g | 350 g | 400 g |
| Buffer ingredients: water, salt, and dish soap | 50 mL + 2 g + 10 mL | 300 mL + 12 g + 60 mL | 350 mL + 14 g + 70 mL | 400 mL + 16 g + 80 mL |
| Cold isopropyl alcohol | 60 mL | 360 mL | 420 mL | 480 mL |
| Resealable bags, filters, clear vessels, sticks, and labels | 2 of each | 12 of each | 14 of each | 16 of each |
| Balances, measuring cylinders, and paper-towel sets | 1 of each | 6 of each | 7 of each | 8 of each |
| Splash goggles | 1 pair per student | 20 pairs | 25 pairs | 30 pairs |
| Student observation sheets | 1 per student | 20 copies | 25 copies | 30 copies |
Prepare 6 kits for 20 · 7 kits for 25 · 8 kits for 30 students.
Lesson flow
| Minutes | What happens |
|---|---|
| S1 · 0–4 | Engage Present the equal-mass fruit question. Students predict similar or different visible precipitate and note that chromosome-set count alone cannot pick a winner. |
| S1 · 4–10 | Explore Weigh three separate 50 g portions of each fruit. Teacher checks goggles and clears flames, sparks and heat before dispensing chilled alcohol. |
| S1 · 10–22 | Explore Mash all six samples separately for the same 1–2 minutes with equal 30 mL portions of the shared buffer. |
| S1 · 22–32 | Filter each sample through a fresh coffee filter into its own labeled vessel. The filtrate contains DNA and other cell material. |
| S1 · 32–40 | Tilt all six vessels and slowly layer 30 mL cold alcohol down each side. Leave layers separate and clear the area for the second session. |
| S2 · 0–8 | Explain Rate each of the six precipitates with the same 1–5 scale; describe texture and location at every boundary. |
| S2 · 8–15 | Elaborate Calculate each fruit's median rating and range, then compare without treating a thicker cloudy layer as precise DNA mass or a pure sample. |
| S2 · 12–15 | Evaluate Use the extraction steps as evidence to explain how cell material becomes visible and name one limit of the model. |
Discussion questions
1. What did the pale strands at the boundary show?
2. What did mashing and dish soap contribute?
3. Why should we avoid predicting that strawberry must produce more visible material than banana?
4. What can this extraction not tell us about DNA?
Common misconceptions
Differentiation
SUPPORT
- Color-code three labeled replicates for each fruit and complete the same step for all six samples.
- Provide the 1–5 scale beside the cups: 1 none, 2 faint, 3 clear, 4 abundant, 5 very abundant visible material.
- Offer sentence frames: “At the alcohol boundary I saw ___; I rated it ___ because ___.”
EXTEND
- Repeat with two soap amounts while keeping fruit mass, salt, water, mash time, filter and alcohol volume fixed.
- Compare two ripeness levels of one fruit at equal mass and use the same extraction steps.
- Photograph all six vessels from the same angle and lighting, then explain why image thickness still is not a validated DNA-mass measurement.
Assessment rubric
| Criterion | Beginning | Developing | Secure |
|---|---|---|---|
| Observation detail | Does not describe visible material. | Names a color or amount but omits where it appeared. | Describes amount, texture and location at the extract–alcohol boundary. |
| Classification | Does not use the shared scale. | Scores samples but applies the scale inconsistently. | Uses the same 1–5 descriptors for all three equal-mass extracts of each fruit. |
| Explanation | Says the precipitate is pure DNA or uses ploidy as proof of yield. | Names a step but does not connect it to visible material. | Connects mashing, membrane disruption, filtering and cold alcohol while recognizing the precipitate is mixed material. |
| Communication | Does not identify the fruit or the comparison. | Reports which looked different without the controlled conditions. | Compares equal starting masses and shared extraction steps, then states a limitation of the observation. |
Vocabulary
- Precipitate – Material that comes out of solution and becomes visible under these extraction conditions.
- Cell membrane – A boundary around a cell that separates its contents from the outside.
- Nuclear membrane – The membrane around the nucleus, which also has to be disrupted to release its contents.
- Filtrate – The liquid that passes through a filter, carrying small and dissolved materials.
- Ploidy – The number of complete chromosome sets in a cell.
- Extraction – A process that separates selected material from the sample that contains it.
Safety, cleanup and troubleshooting
BEFORE STUDENTS TOUCH ANYTHING
- Rubbing alcohol is flammable. Keep it away from flames, sparks, hot plates, and other heat sources; have an adult handle the alcohol and any chilled container.
- Wear splash goggles, do not taste any sample, and never pipette by mouth. If alcohol gets into eyes, rinse with clean water and alert the supervising adult.
Troubleshooting: If no pale strands appear, check that the alcohol stayed cold, was poured slowly down the tilted cup wall and was not mixed into the extract. If the extract stays very pulpy, check that it passed through the filter rather than around a torn or displaced edge.