Can multimodal AI read values and trends from a graph accurately?
01 // Question
For a fixed set of verified graphs, how accurately does one multimodal AI model report plotted values, trend direction and change?
The result describes one model, prompt, chart set and date. It is not a score for all multimodal AI or an endorsement for scientific decisions without human checking.
02 // Variables
Independent
Chart feature group- Simple single-series line charts
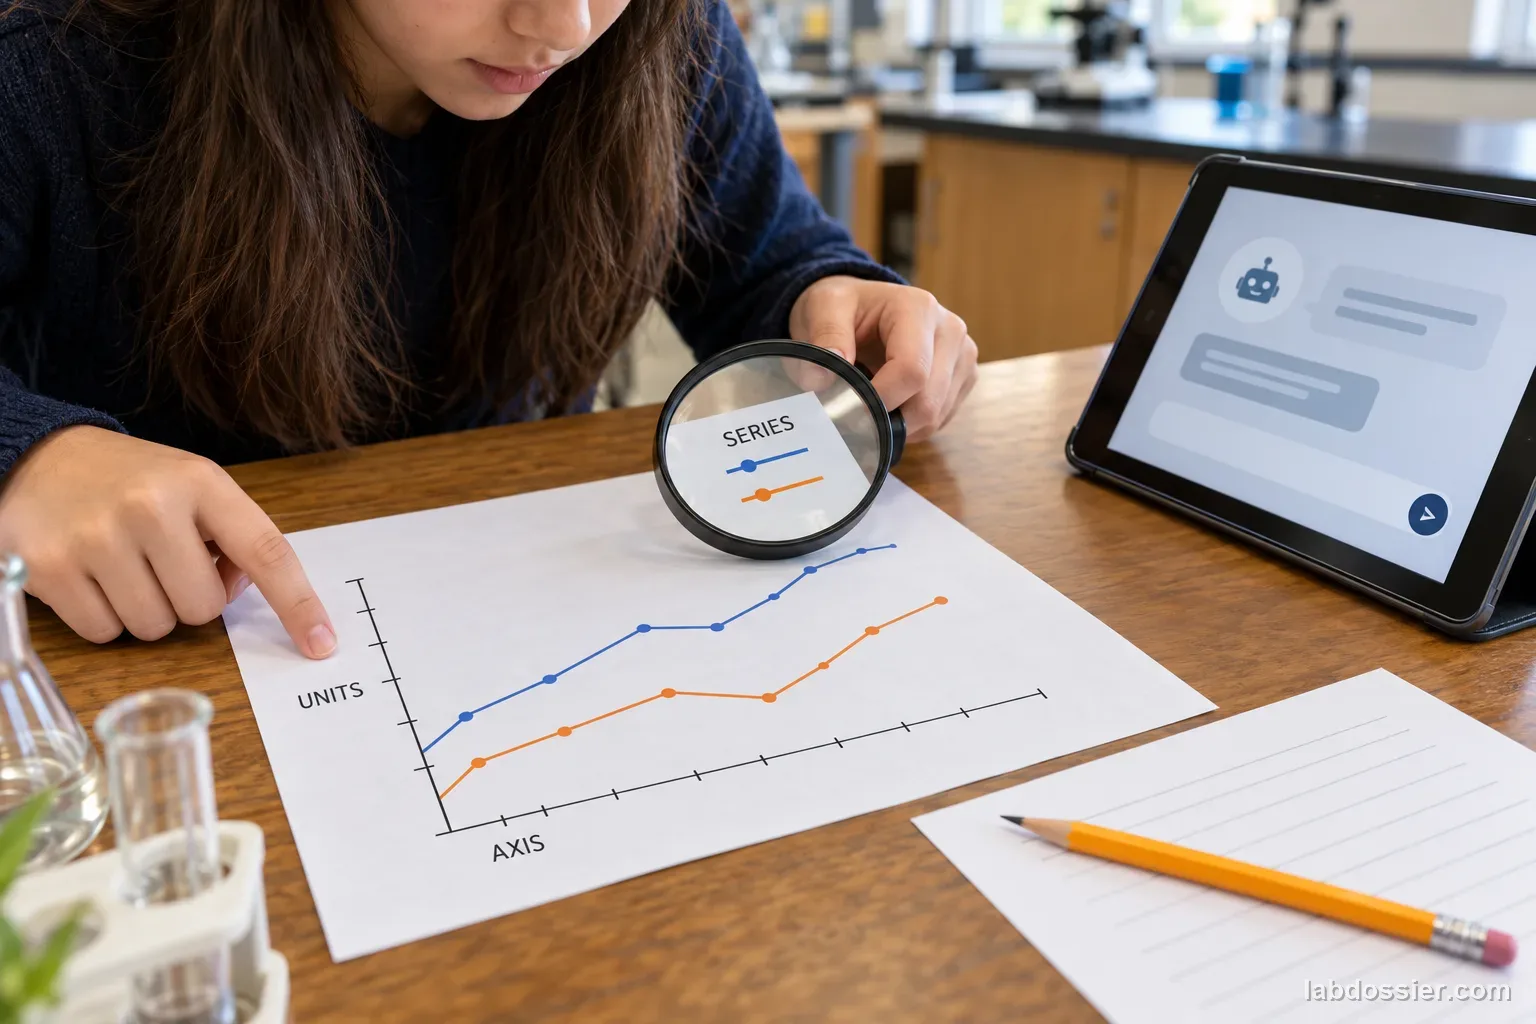
- Two-series charts with a legend
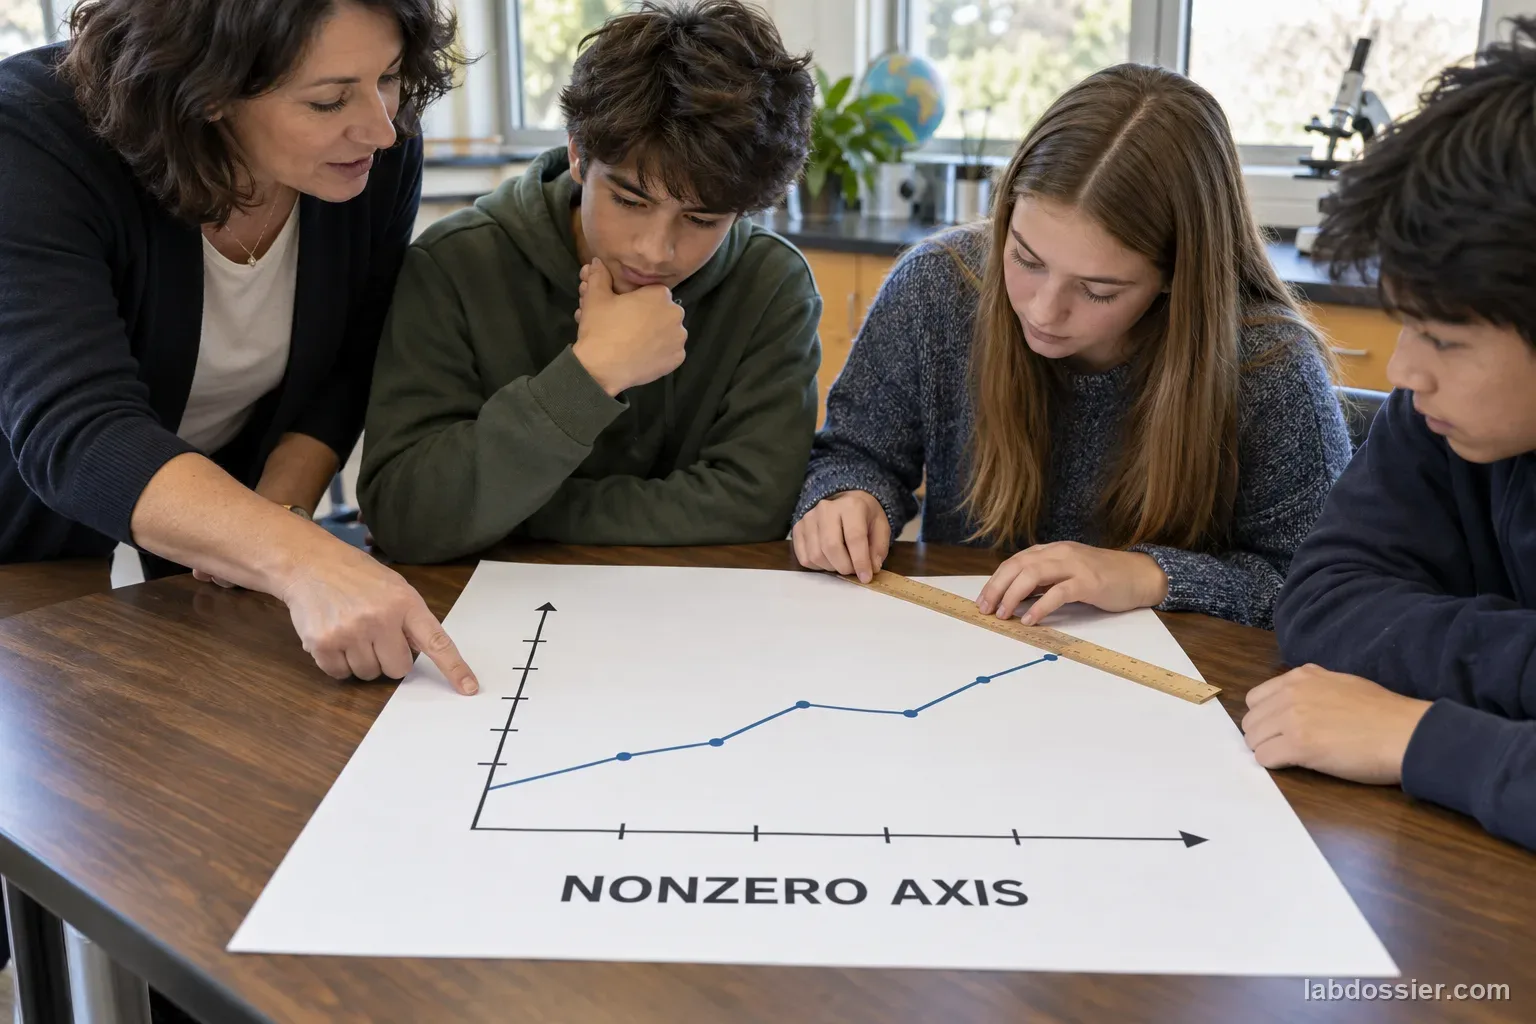
- Single-series charts with a nonzero vertical-axis start
Dependent
Agreement with the chart's verified source data- Numeric absolute error in the graph's units
- Correct trend direction or comparison
- Whether labels, units and legend were interpreted correctly
03 // Hypothesis
IF the chart contains more visual features such as a legend or a nonzero axis start, THEN the model's value-reading and trend answers may differ from simpler charts, BECAUSE a chart answer depends on reading axes and visual encodings before doing the requested comparison, but this test does not predict a result.
04 // Procedure
1. Build a verified chart set
With a teacher, create 12 line charts from small, invented classroom datasets whose exact values are saved in a source table. Make four simple single-series charts, four two-series charts with clear legends, and four single-series charts with nonzero y-axis starts. Keep chart titles, fonts and image size readable. Have two people check every plotted point, axis tick, unit and legend against the source table before testing.
2. Write questions and freeze the key
For each chart, prepare the same three question types: read one specified point, state whether the selected series rises/falls/stays level from the first to last point, and calculate the endpoint change. Record exact answers and units from the source table before any AI run. Avoid questions where a point falls between ticks unless a clear tolerance is defined.
3. Fix the model and prompt
Use one teacher-approved image-capable AI tool. Record its name, visible model/version, date, image resolution and settings; turn off browsing, code execution and external tools if the product allows. Use one fixed prompt requesting a concise value with unit or one of the trend labels. If a setting cannot be disabled or verified, note that limit.
4. Test all charts in mixed order
Use a fresh chat for each chart and ask its three prewritten questions without supplying the source table. Randomize the 12 chart IDs in advance. Do not correct the model or reveal answers between charts. Save the complete answer, including refusals, missing units and uncertainty; do not count an unsupported guess as correct.
5. Score numbers and trends separately
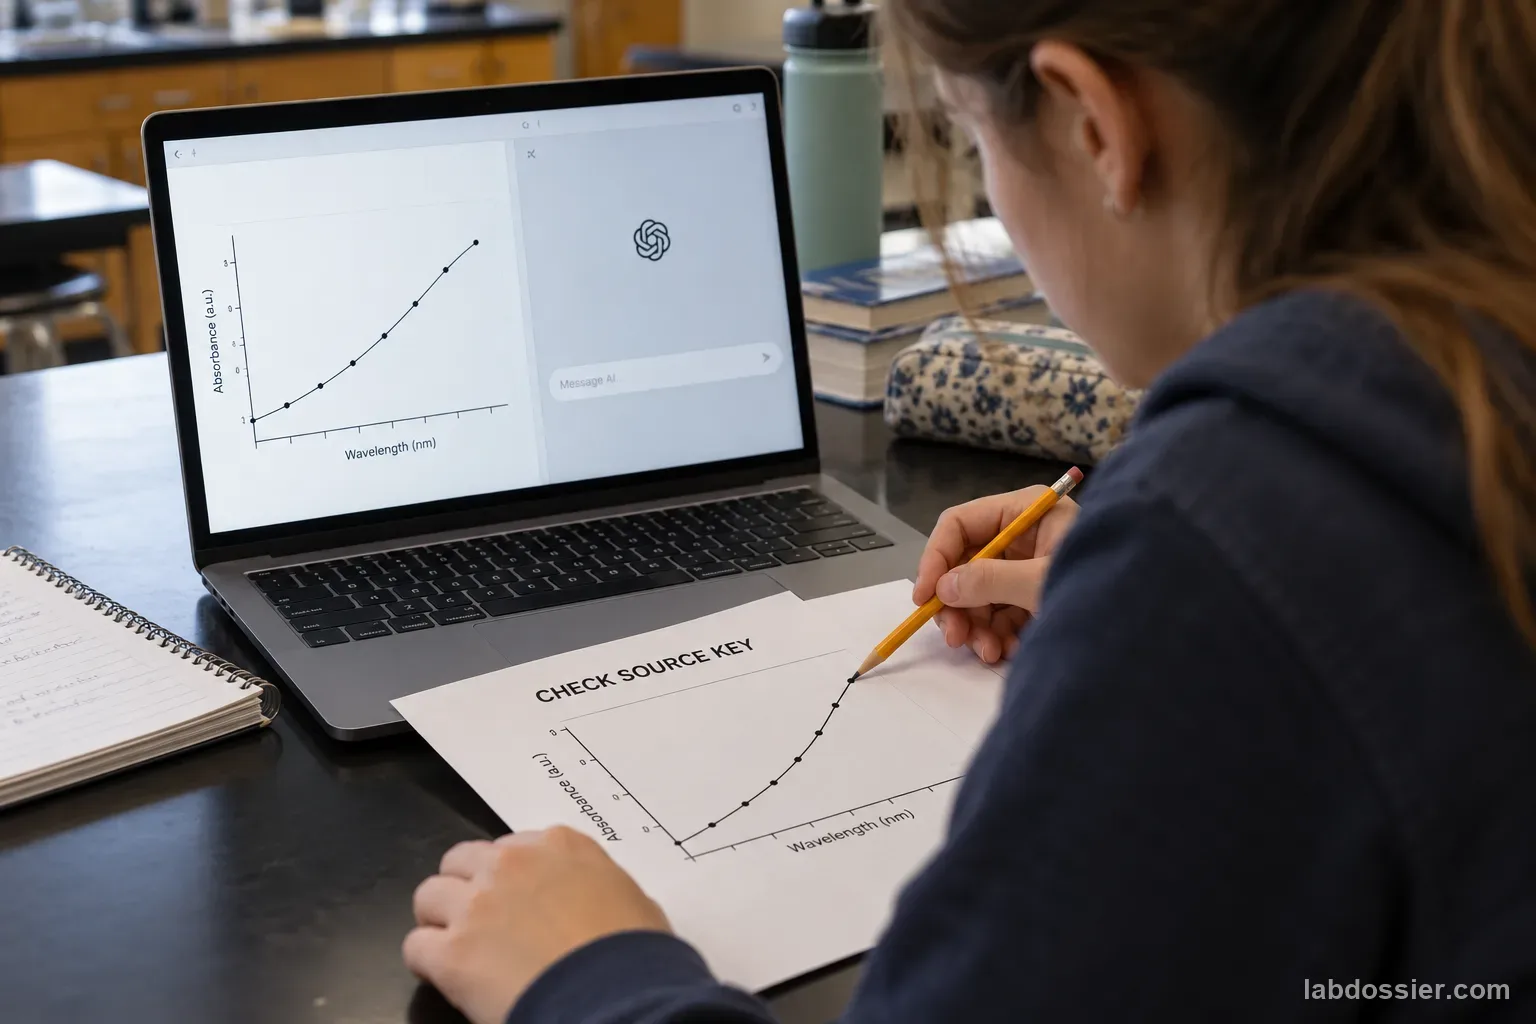
Compare every number with the frozen source key. Record absolute error in the chart's units; before testing, set a tolerance no wider than half the smallest labeled grid interval. Score direction/comparison as correct or incorrect. For two-series charts, check that the named series matches the legend. Keep unreadable or ambiguous answers in the raw record and mark them separately.
6. Compare chart groups carefully
Each of the three chart groups contains four charts and 12 questions. Show counts and the raw error values before percentages or averages. Compare question types separately, then describe the small group patterns. The charts were made for this class, so repeated templates and four charts per group cannot establish a general chart-reading ability.
Materials // Prepare the bench
- teacher-approved AI tool that accepts chart images
- 12 teacher-made line charts from saved source tables
- printed or digital answer key checked by two people
- same computer and fixed image-resolution export
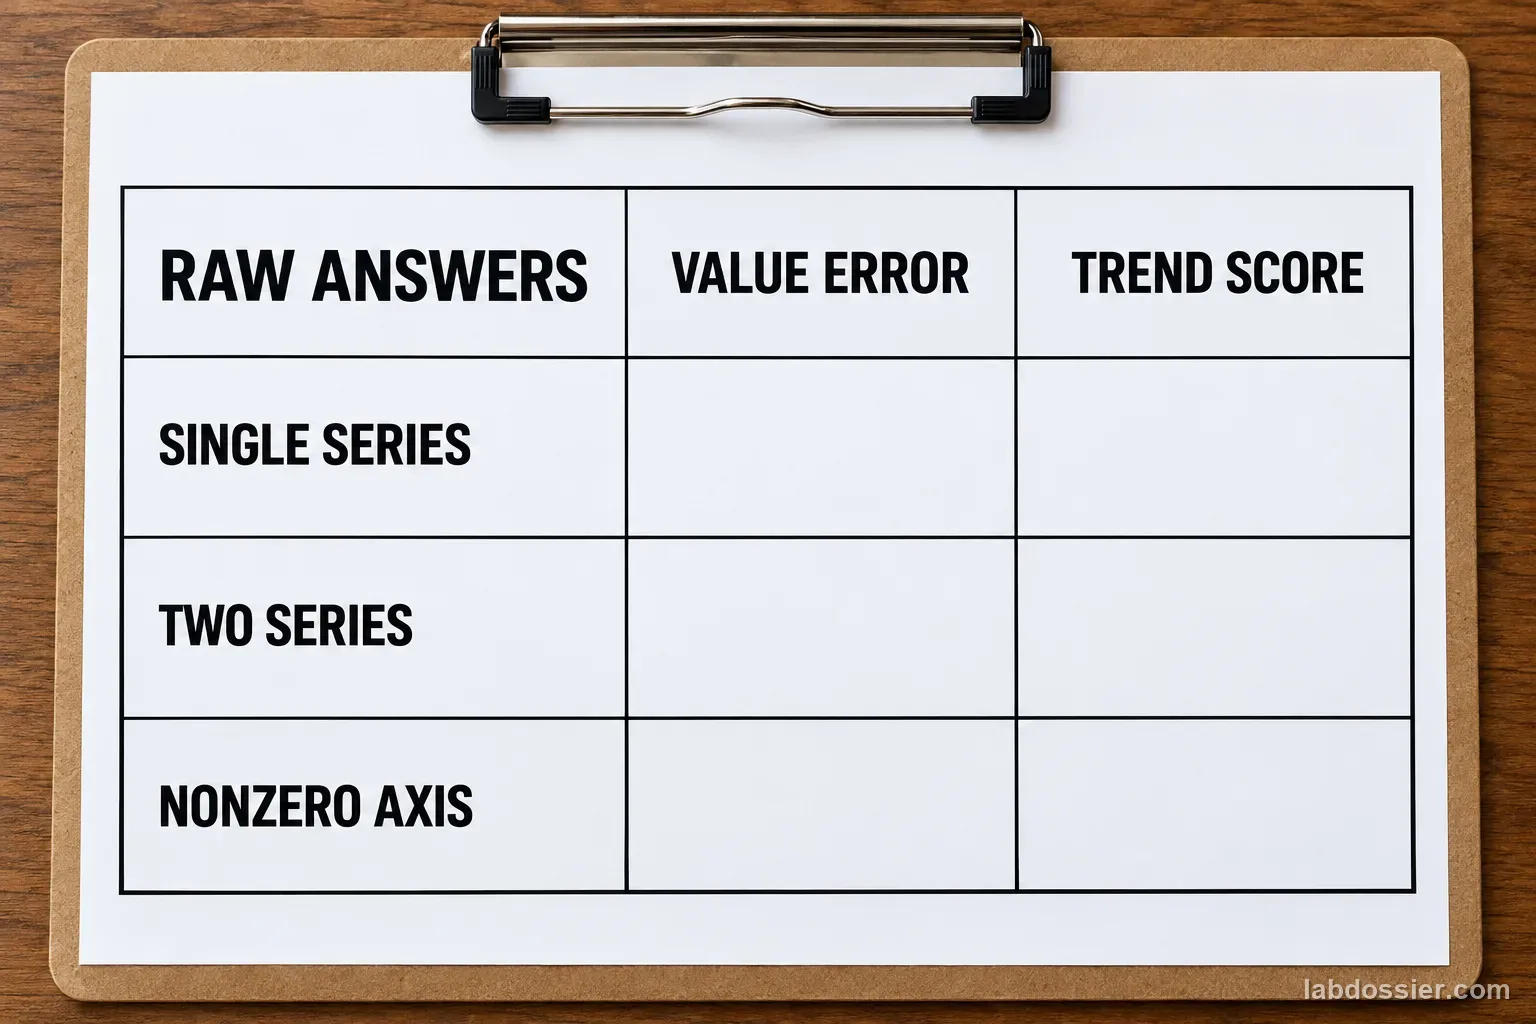
- 36-row raw-answer sheet
- teacher approval for the tool and its privacy settings
05 // Data table
| Chart / type | Question type | Verified answer / unit | AI answer | Absolute numeric error or trend score | Scoring note |
|---|---|---|---|---|---|
| G01 / single-series | point value | units / legend / unclear | |||
| G01 / single-series | trend direction | units / legend / unclear | |||
| G01 / single-series | endpoint change | units / legend / unclear | |||
| G02 / single-series | point value | units / legend / unclear | |||
| G02 / single-series | trend direction | units / legend / unclear | |||
| G02 / single-series | endpoint change | units / legend / unclear | |||
| G03 / single-series | point value | units / legend / unclear | |||
| G03 / single-series | trend direction | units / legend / unclear | |||
| G03 / single-series | endpoint change | units / legend / unclear | |||
| G04 / single-series | point value | units / legend / unclear | |||
| G04 / single-series | trend direction | units / legend / unclear | |||
| G04 / single-series | endpoint change | units / legend / unclear | |||
| G05 / two-series | point value | units / legend / unclear | |||
| G05 / two-series | trend direction | units / legend / unclear | |||
| G05 / two-series | endpoint change | units / legend / unclear | |||
| G06 / two-series | point value | units / legend / unclear | |||
| G06 / two-series | trend direction | units / legend / unclear | |||
| G06 / two-series | endpoint change | units / legend / unclear | |||
| G07 / two-series | point value | units / legend / unclear | |||
| G07 / two-series | trend direction | units / legend / unclear | |||
| G07 / two-series | endpoint change | units / legend / unclear | |||
| G08 / two-series | point value | units / legend / unclear | |||
| G08 / two-series | trend direction | units / legend / unclear | |||
| G08 / two-series | endpoint change | units / legend / unclear | |||
| G09 / nonzero axis | point value | units / legend / unclear | |||
| G09 / nonzero axis | trend direction | units / legend / unclear | |||
| G09 / nonzero axis | endpoint change | units / legend / unclear | |||
| G10 / nonzero axis | point value | units / legend / unclear | |||
| G10 / nonzero axis | trend direction | units / legend / unclear | |||
| G10 / nonzero axis | endpoint change | units / legend / unclear | |||
| G11 / nonzero axis | point value | units / legend / unclear | |||
| G11 / nonzero axis | trend direction | units / legend / unclear | |||
| G11 / nonzero axis | endpoint change | units / legend / unclear | |||
| G12 / nonzero axis | point value | units / legend / unclear | |||
| G12 / nonzero axis | trend direction | units / legend / unclear | |||
| G12 / nonzero axis | endpoint change | units / legend / unclear |
Summarize the three chart feature groups
| Chart group | Numeric questions within tolerance / 8 | Trend answers correct / 4 | Median numeric error | Common issue |
|---|---|---|---|---|
| Single-series, zero baseline | ||||
| Two series with legend | ||||
| Single series, nonzero axis |
Check each graph before asking the model
| Chart check | Verified | Needs correction |
|---|---|---|
| Every plotted point matches the saved source table | ||
| Axes start, scale, tick spacing and units are legible | ||
| Two-series legend maps each line correctly | ||
| Question wording identifies the point or series unambiguously |
Formula Numeric absolute error = |AI-reported value − source-table value| (in the graph's units)
06 // What to expect
A model can answer a trend question correctly while misreading an exact value; score them separately.
A legend or nonzero axis may change what must be interpreted before answering; this test does not assume which group will be harder.
Four charts per group are descriptive and cannot establish overall multimodal AI accuracy.
07 // Lab notes
- Do not use a model's graph reading as the sole basis for lab conclusions, grades, medical choices, financial decisions or safety actions.
08 // Remember
Trace the plotted point back to the axis and source table. A plausible graph answer is only reliable when the value, units, series and scale all match.
09 // Build a verified chart set
Create four single-series charts with a zero baseline, four two-series charts with a readable legend, and four single-series charts whose vertical axes begin above zero. Use small classroom-created values, label every axis and unit, and save each source table beside its exported chart. Keep fonts, image dimensions and visual quality consistent. Two people should verify every plotted point, tick interval, series label and axis start before the charts enter the test set.
Use distinct data values and avoid making one chart group systematically more cluttered or lower resolution. The three groups isolate selected visual features only approximately; they do not make every chart equally difficult. If a chart is ambiguous to a person checking the key, revise it before model testing rather than scoring an uncertain answer as an AI error.
10 // Write questions and freeze the key
For each chart, write three short questions before testing: read one clearly marked point, identify the selected series' overall direction from first to last point, and calculate the endpoint change. Record the exact expected number, units, series and trend beside the chart ID. Set a numeric tolerance no wider than half of the smallest labeled grid interval, and freeze that rule with the key.
Choose question wording that does not accidentally reveal an answer or point to a different line. Keep the source tables out of the AI prompts. The key should be answerable from both the chart and saved values so a scorer can separate model-reading mistakes from a chart construction or scoring mistake.
11 // Score numbers and trends separately
Use one model and fixed settings for all 12 charts. Save its name, visible version, date, prompt and whether browsing or tools could be disabled. Ask the same three question types in fresh chats, randomize chart order, and preserve the complete responses. Do not correct the model between charts or select only its clearest answer.
For numeric answers, calculate absolute error as |reported value − verified value| in the chart's units. Score trend direction independently as correct, incorrect or unclear. For two-series charts, also check whether the response followed the named legend entry. Keep missing units, refusals and ambiguous answers visible in the raw record rather than converting them into an unearned correct score.
12 // Compare chart groups carefully
Each chart group has four charts and 12 total questions: four point values, four trend labels and four endpoint changes. Report raw counts, numeric errors, unclear responses and common reading issues separately. A median error can summarize the numeric answers, but show the individual values and units alongside it; a small group can be changed substantially by one chart.
Describe only what happened for these charts, this prompt and the model version tested. The set does not cover every graph type, image quality, language, model or tool configuration. A classroom result is a useful reason to verify AI-assisted graph reading, not a general accuracy claim or a substitute for checking scientific data.
13 // Questions people ask
Why test values and trends as different questions?
Reading one plotted coordinate requires estimating a value from axes, while describing a trend requires comparing multiple points. One score can hide which task caused an error.
Why include a chart with a nonzero y-axis?
The reader must notice the labeled starting point and scale. Record that feature explicitly and check that the model does not treat the baseline as zero.
How much numeric error should count as correct?
Set the rule before testing. This activity uses no wider than half the smallest labeled grid interval and also retains the actual error in the graph's units.
Can a multimodal model use tools to read the graph?
Tool use changes the system being evaluated. Turn it off when possible, or clearly record which OCR, browser, code or chart-extraction tools were active.
Does this measure every kind of chart?
No. It tests 12 classroom line charts in three selected formats. Other chart types, image quality, model versions and question wording may produce different results.
Can you explain the investigation?
Can multimodal AI read values and trends from a graph accurately? · Student Data Sheet
Question: For a fixed set of verified graphs, how accurately does one multimodal AI model report plotted values, trend direction and change?
Hypothesis: If the chart contains more visual features such as a legend or a nonzero axis start, then the model's value-reading and trend answers may differ from simpler charts, because a chart answer depends on reading axes and visual encodings before doing the requested comparison, but this test does not predict a result.
Materials
- teacher-approved AI tool that accepts chart images
- 12 teacher-made line charts from saved source tables
- printed or digital answer key checked by two people
- same computer and fixed image-resolution export
- 36-row raw-answer sheet
- teacher approval for the tool and its privacy settings
Safety before starting
- Use public, synthetic, or teacher-created charts. Remove names, health information, grades, account data, and confidential details before sharing a chart with an AI service.
- Verify every reported value and trend against the original axes, units, legend, and source key. Do not rely on model output for consequential medical, legal, financial, or safety decisions.
Lab notes
- Do not use a model's graph reading as the sole basis for lab conclusions, grades, medical choices, financial decisions or safety actions.
Variables
Independent: Chart feature group · Dependent: Agreement with the chart's verified source data
Keep constant: same model/version and settings · same fixed prompt · web search and tools off · 12 teacher-checked charts · same three question types per chart · answer key frozen first · consistent image resolution
Procedure
- Build a verified chart set: With a teacher, create 12 line charts from small, invented classroom datasets whose exact values are saved in a source table. Make four simple single-series charts, four two-series charts with clear legends, and four single-series charts with nonzero y-axis starts. Keep chart titles, fonts and image size readable. Have two people check every plotted point, axis tick, unit and legend against the source table before testing.
- Write questions and freeze the key: For each chart, prepare the same three question types: read one specified point, state whether the selected series rises/falls/stays level from the first to last point, and calculate the endpoint change. Record exact answers and units from the source table before any AI run. Avoid questions where a point falls between ticks unless a clear tolerance is defined.
- Fix the model and prompt: Use one teacher-approved image-capable AI tool. Record its name, visible model/version, date, image resolution and settings; turn off browsing, code execution and external tools if the product allows. Use one fixed prompt requesting a concise value with unit or one of the trend labels. If a setting cannot be disabled or verified, note that limit.
- Test all charts in mixed order: Use a fresh chat for each chart and ask its three prewritten questions without supplying the source table. Randomize the 12 chart IDs in advance. Do not correct the model or reveal answers between charts. Save the complete answer, including refusals, missing units and uncertainty; do not count an unsupported guess as correct.
- Score numbers and trends separately: Compare every number with the frozen source key. Record absolute error in the chart's units; before testing, set a tolerance no wider than half the smallest labeled grid interval. Score direction/comparison as correct or incorrect. For two-series charts, check that the named series matches the legend. Keep unreadable or ambiguous answers in the raw record and mark them separately.
- Compare chart groups carefully: Each of the three chart groups contains four charts and 12 questions. Show counts and the raw error values before percentages or averages. Compare question types separately, then describe the small group patterns. The charts were made for this class, so repeated templates and four charts per group cannot establish a general chart-reading ability.
Record your observations
| Chart / type | Question type | Verified answer / unit | AI answer | Absolute numeric error or trend score | Scoring note |
|---|---|---|---|---|---|
Summarize the three chart feature groups
| Chart group | Numeric questions within tolerance / 8 | Trend answers correct / 4 | Median numeric error | Common issue |
|---|---|---|---|---|
Check each graph before asking the model
| Chart check | Verified | Needs correction |
|---|---|---|
Formula: Numeric absolute error = |AI-reported value − source-table value| (in the graph's units)
Answer key and expected pattern
A model can answer a trend question correctly while misreading an exact value; score them separately.
A legend or nonzero axis may change what must be interpreted before answering; this test does not assume which group will be harder.
Four charts per group are descriptive and cannot establish overall multimodal AI accuracy.
Remember: Trace the plotted point back to the axis and source table. A plausible graph answer is only reliable when the value, units, series and scale all match.