How do AI and conventional weather forecasts compare on the same dates?
01 // Question
For one chosen location and 14 matched dates, which of ECMWF AIFS or IFS has the lower mean absolute error for 24-hour-ahead daily maximum temperature against a shared ERA5 reference?
This is one location, variable, forecast horizon, archive window and model pair. ERA5 is a reanalysis reference, not a thermometer reading or a perfect account of local weather.
02 // Variables
Independent
Forecast system for each matched date- ECMWF AIFS Single, data-driven model
- ECMWF IFS, numerical weather prediction model
- Each evaluated at the same 24-hour lead and location
Dependent
Daily maximum-temperature error against one common reference- Absolute error for each system on each date
- Mean absolute error (MAE) over matched dates
- Signed bias and which system is closer on each paired date
03 // Hypothesis
IF AIFS and IFS forecasts are compared at the same place, valid time and lead time, THEN one system may have a lower average error in this selected sample, or their errors may be similar, BECAUSE forecast quality depends on the variable, lead, weather pattern, location, model version, reference and scoring method—not only on whether a system uses machine learning.
04 // Procedure
1. Choose one location and a complete date window
With a teacher, choose one public location and record latitude, longitude, elevation if shown, and time zone. Select 14 consecutive dates that the archived AIFS and IFS data both cover. Use the Previous Model Runs archive rather than today's seamless forecast, which can switch models between updates. If either forecast is missing for a date, omit that date from both systems and record why; do not substitute a different lead time.
2. Request matched forecasts
Select ECMWF AIFS 0.25° Single and ECMWF IFS 0.25° explicitly; do not use Best Match or a seamless blend. Retrieve 2-m air temperature at a fixed 24-hour lead for every hourly valid time in each date. Convert both series to the same local time zone and Celsius. Keep the original CSV/API export and the model names, version notes, request date and full query settings.
3. Create one shared reference series
Retrieve hourly ERA5 reanalysis temperature for the same coordinates and valid dates from the Historical Weather API. For each date, calculate the maximum of the hourly forecast values and the maximum of the hourly ERA5 values using the identical local-day window. ERA5 blends observations with a weather model to reconstruct past conditions; label it reanalysis, not a local station measurement. A teacher may substitute a nearby official station only if both forecasts and station timestamps can be aligned consistently.
4. Calculate paired errors
For each date, calculate absolute error = |forecast daily maximum − ERA5 daily maximum| for AIFS and IFS separately. Also calculate signed error = forecast − ERA5, so warm and cool biases remain visible. Check the dates, missing hours, units and daily-window boundaries before making a graph. Never compare one system's 24-hour lead with the other's 48-hour lead.
5. Compare the sample without overclaiming
Calculate each model's MAE as the mean of its 14 absolute errors, and show the 14 paired rows as well as the averages. Count dates when AIFS has lower error, IFS has lower error or they tie within the recorded data precision. Plot the three daily maxima and a separate paired-error graph; identify outliers without deleting them. The result describes this selected location, time window, archived versions and ERA5 reference only.
Materials // Prepare the bench
- teacher-approved browser or spreadsheet
- Open-Meteo Previous Model Runs archive
- ECMWF AIFS Single and IFS 0.25° model selections
- ERA5 hourly reanalysis reference
- one recorded location and time zone
- 14-date paired forecast worksheet or CSV
05 // Data table
| Date | AIFS daily max (°C) | IFS daily max (°C) | ERA5 daily max (°C) | AIFS absolute error (°C) | IFS absolute error (°C) | Missing-hour / source note |
|---|---|---|---|---|---|---|
| Day 01 | ||||||
| Day 02 | ||||||
| Day 03 | ||||||
| Day 04 | ||||||
| Day 05 | ||||||
| Day 06 | ||||||
| Day 07 | ||||||
| Day 08 | ||||||
| Day 09 | ||||||
| Day 10 | ||||||
| Day 11 | ||||||
| Day 12 | ||||||
| Day 13 | ||||||
| Day 14 |
Keep both forecasts on equal terms
| Design choice | AIFS column | IFS column | Shared rule |
|---|---|---|---|
| System | ECMWF AIFS Single | ECMWF IFS | Select each model directly; avoid Best Match |
| Lead time | 24 hours before valid time | 24 hours before valid time | Use the same forecast offset |
| Place and time | same coordinates and local day | same coordinates and local day | Keep one location, time zone and date set |
| Reference | ERA5 reanalysis | ERA5 reanalysis | Use the same hourly series and daily maximum calculation |
Read the error measures
| Measure | How to calculate | What it shows |
|---|---|---|
| Absolute error | |forecast − ERA5| | Size of the miss without direction |
| Signed error | forecast − ERA5 | Warm bias if positive; cool bias if negative |
| MAE | mean of the 14 absolute errors | Average error for this sample |
| Paired-date wins | count dates with smaller absolute error | Which model was closer on each matched date |
Record each day before calculating
| Date | Both forecasts present? | Reference complete? | AIFS closer / IFS closer / tie | Weather or archive note |
|---|---|---|---|---|
| Day 01 | yes / no | yes / no | ||
| Day 02 | yes / no | yes / no | ||
| Day 03 | yes / no | yes / no | ||
| Day 04 | yes / no | yes / no | ||
| Day 05 | yes / no | yes / no | ||
| Day 06 | yes / no | yes / no | ||
| Day 07 | yes / no | yes / no | ||
| Day 08 | yes / no | yes / no | ||
| Day 09 | yes / no | yes / no | ||
| Day 10 | yes / no | yes / no | ||
| Day 11 | yes / no | yes / no | ||
| Day 12 | yes / no | yes / no | ||
| Day 13 | yes / no | yes / no | ||
| Day 14 | yes / no | yes / no |
Formula Absolute error = |forecast − ERA5|; signed error = forecast − ERA5; MAE = sum of absolute errors ÷ matched dates
06 // What to expect
ERA5 is a reanalysis reference formed from past observations and a weather model; it is not an exact station observation.
An average can hide dates when the other system was better; keep the paired daily errors and bias visible.
A short point-level temperature comparison cannot rank all AI and physics-based weather systems or assess warnings, rainfall, extremes or other lead times.
07 // Lab notes
08 // Remember
Match the location, valid time, lead and reference before comparing errors. A fair forecast comparison needs paired dates and one shared verification series.
09 // Choose one location and a complete date window
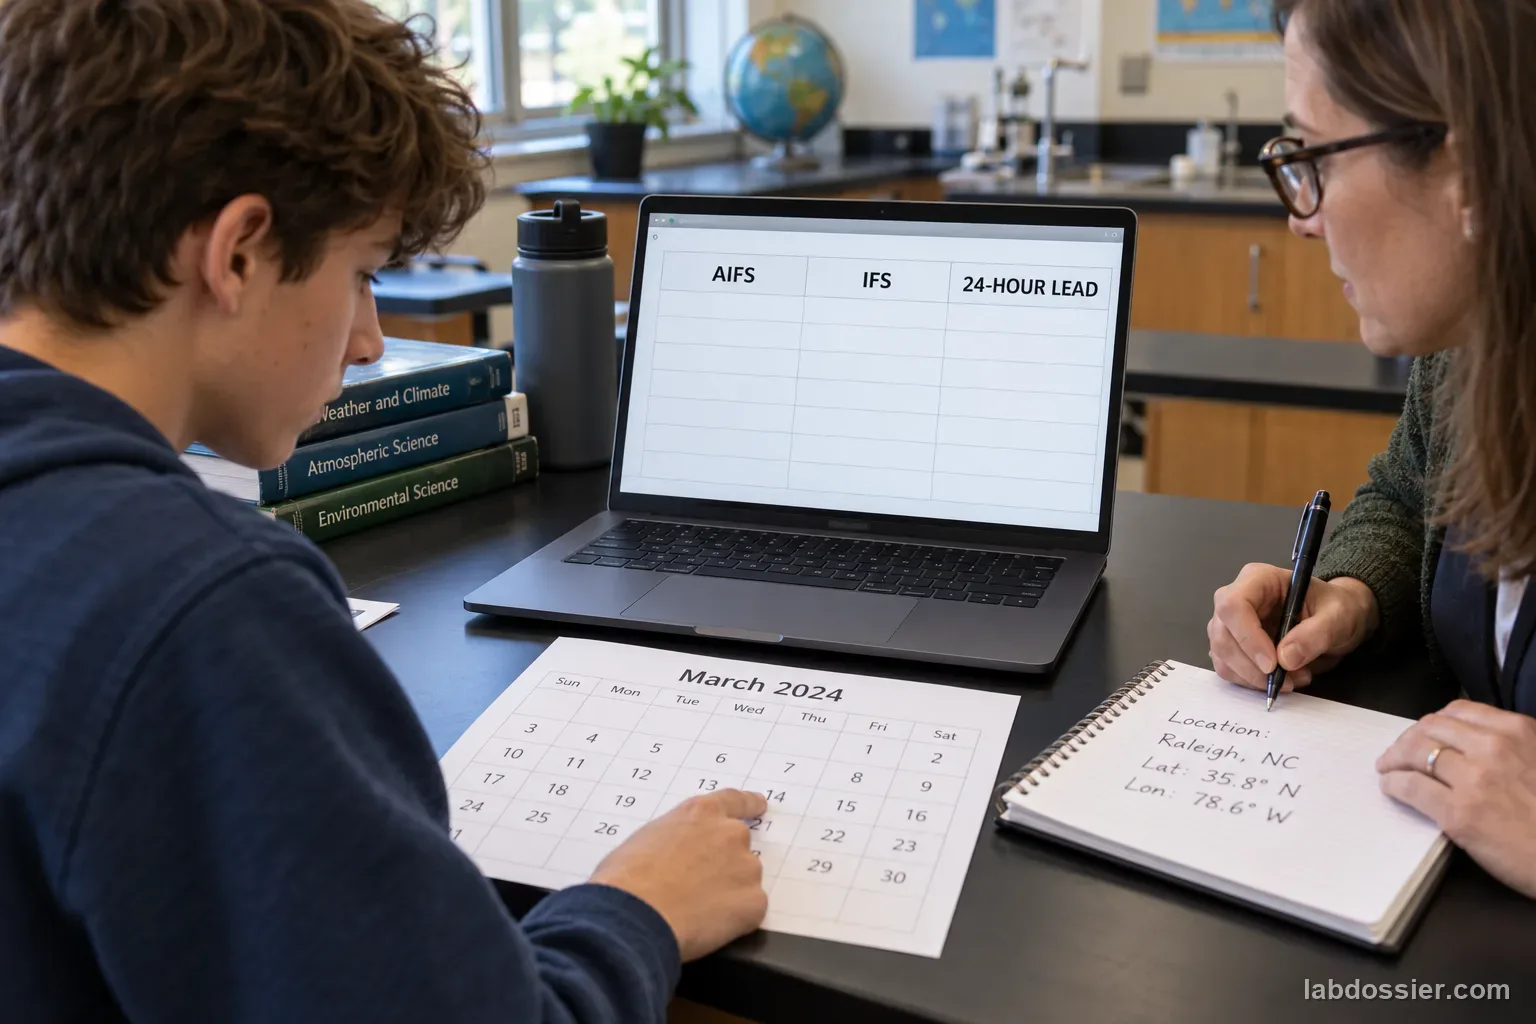
With a teacher, choose a public point and record the coordinates, displayed elevation, time zone and retrieval date. Select 14 consecutive valid dates covered by both the AIFS and IFS archives. Use the Previous Model Runs API, which exposes forecasts at fixed lead-time offsets; do not take a current stitched forecast and call it a historical issued prediction. Confirm that both named model selections are available for every date before downloading.
Set one local-day boundary for the full sample. Keep it unchanged when converting UTC timestamps, grouping hourly temperatures into daily maxima and retrieving ERA5. If a model run or hourly value is absent, mark the date missing for both comparisons and explain the reason; do not quietly substitute another lead, station or forecast source.
10 // Request matched forecasts
Select ECMWF AIFS 0.25° Single and ECMWF IFS 0.25° explicitly. Request 2-m air temperature at a fixed 24-hour lead for each hourly valid time; then compute one daily maximum per date from those hourly forecasts. Keep the location, variable, local time zone, units, date range and 24-hour offset identical. Do not use the default Best Match or a seamless forecast, which may select or join models automatically.
Save the original downloads or exports and write down each model name, visible version information, data provider, retrieval date and any archive notes. ECMWF's AIFS version changed in May 2026; a long date range can cross a model upgrade, so note that break and prefer a period with a consistent documented version when possible. AIFS is data-driven but is initialized from ECMWF operational analysis; it is not independent of all conventional weather inputs.
11 // Create one shared reference series
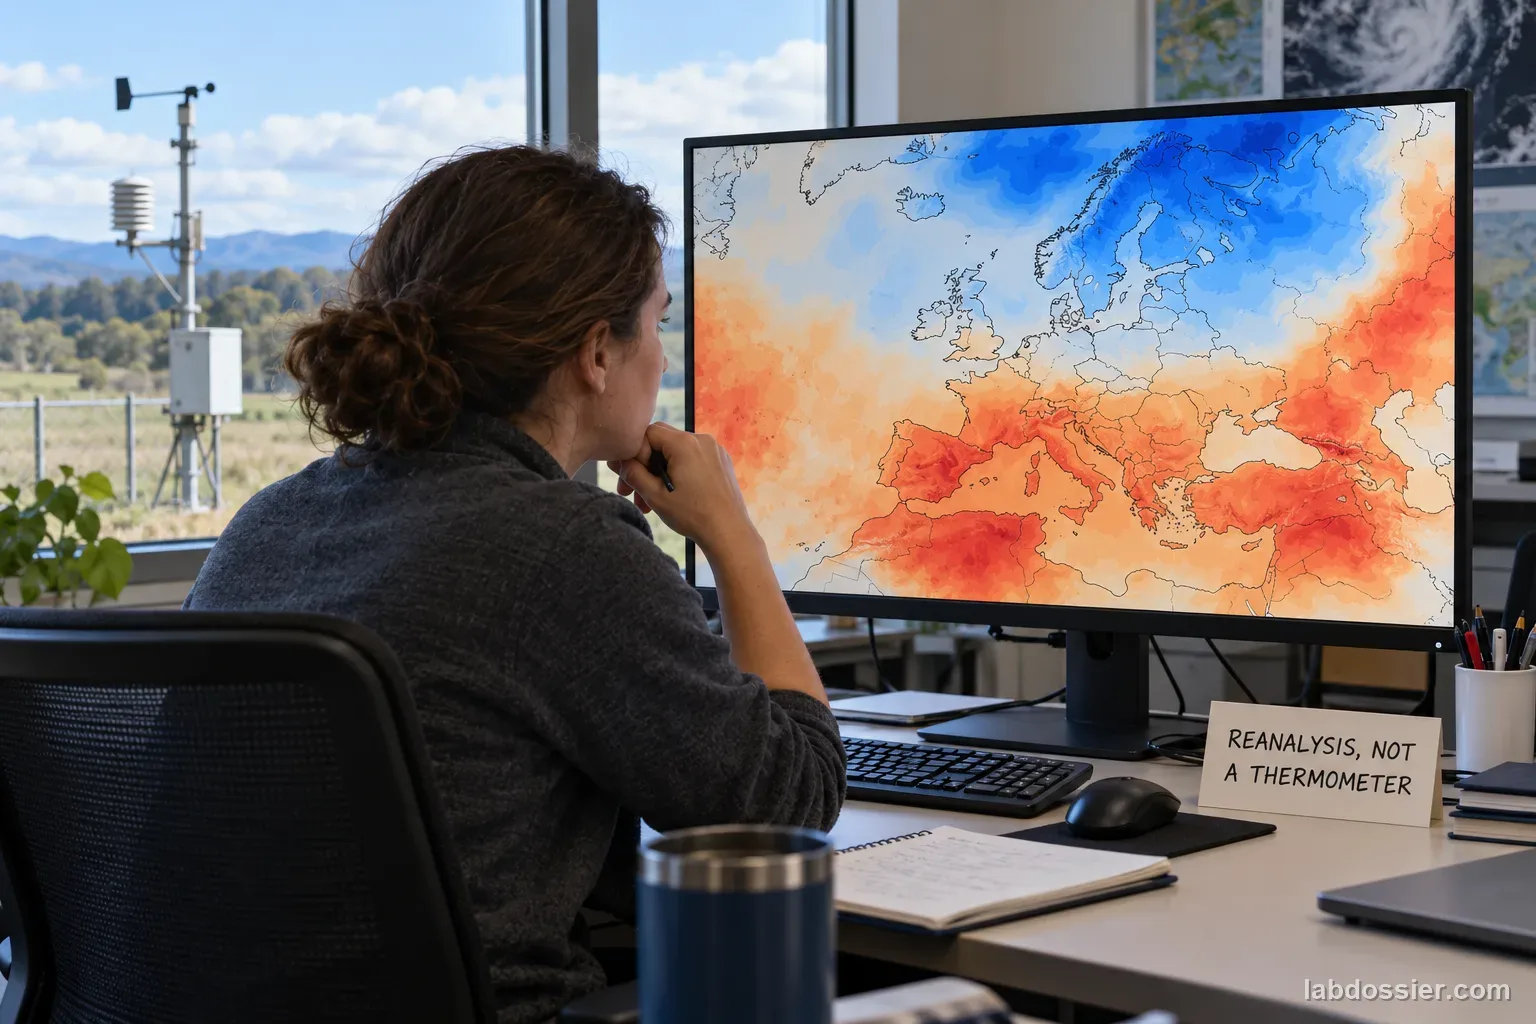
Retrieve hourly ERA5 reanalysis temperature for the same coordinates and valid dates. For each date, calculate the maximum over the same local-day hours for AIFS, IFS and ERA5. ERA5 is a retrospective gridded reanalysis that combines observations with a weather model to estimate past atmospheric conditions. It is a shared reference for this activity, not a perfect truth value or a thermometer located at the exact grid point.
If a nearby official station record is available and a teacher can align station time, exposure, elevation and quality flags, the class may add it as a separate reference. Do not replace ERA5 for only one model, and do not combine the two references into one score.
12 // Calculate paired errors
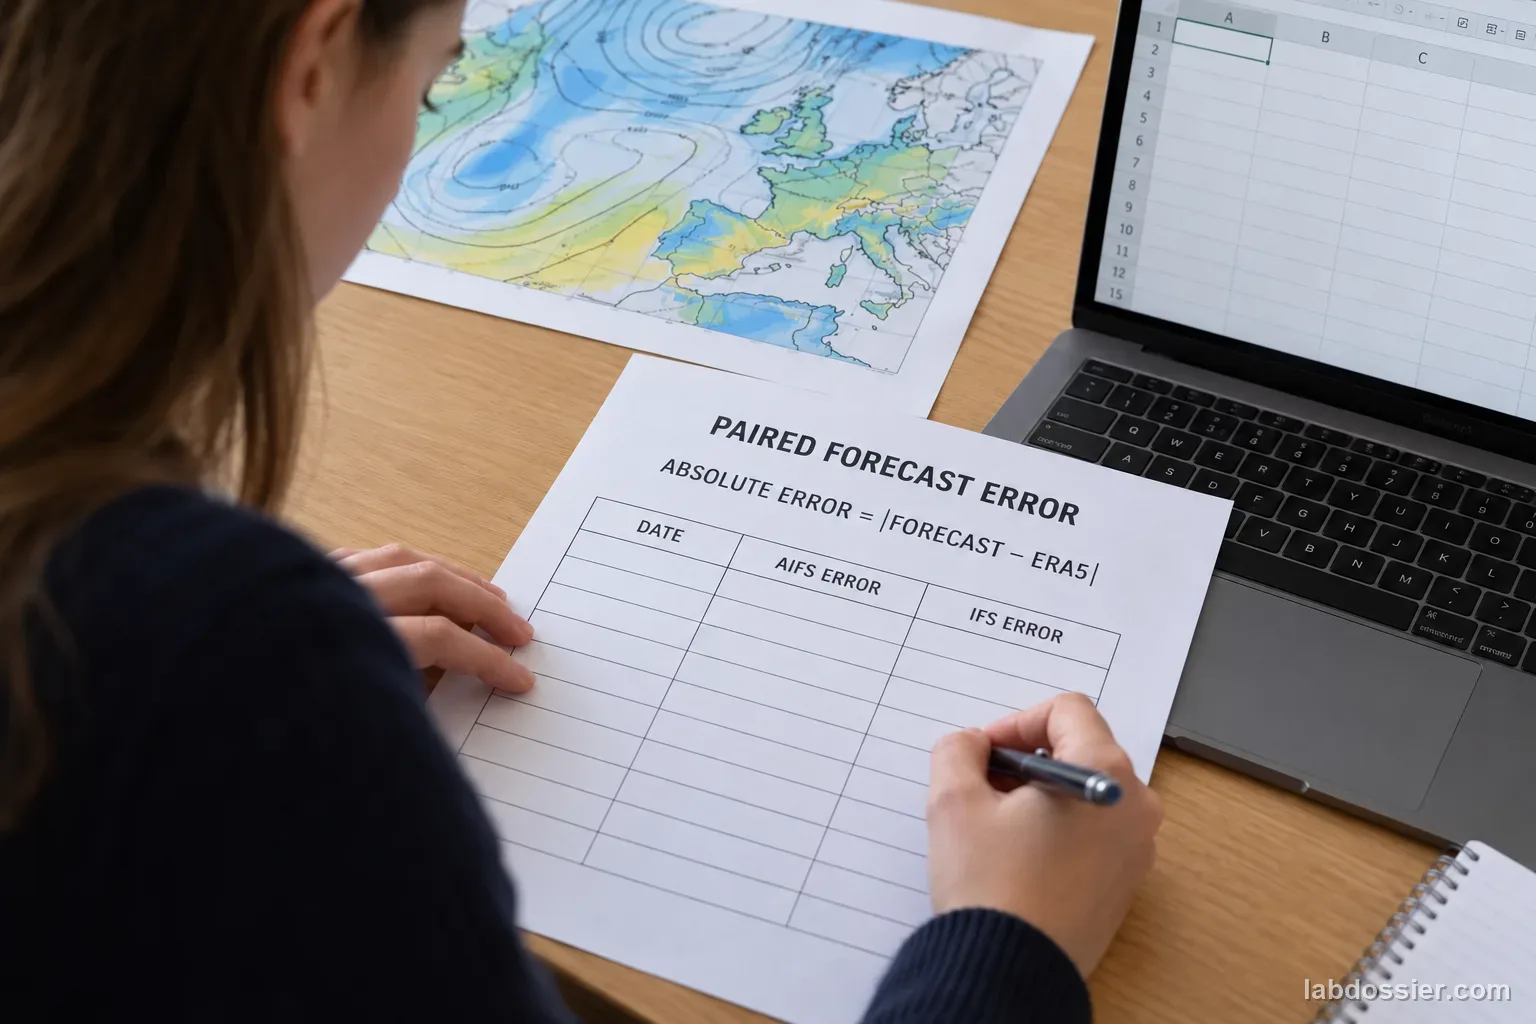
For every matched date, calculate absolute error = |forecast daily maximum − ERA5 daily maximum| for AIFS and IFS separately. Also calculate signed error = forecast − ERA5. Absolute error describes miss size; signed error keeps warm and cool direction. Check units, missing hours, time-zone conversion and date boundaries before calculating. Do not compare AIFS at a 24-hour lead with IFS at a 48-hour lead or one valid date against another date's reference.
Calculate each system's MAE by adding its 14 absolute errors and dividing by the number of matched dates. Keep the daily paired rows, and count dates when each system has lower error or they tie within the input precision. Plot the three maxima and a separate error comparison. Retain outlier dates; explain them rather than dropping them because they change the average.
13 // Compare the sample without overclaiming
Summarize only the chosen location, 14-date window, 24-hour lead, daily maximum temperature, archived model versions and ERA5 reference. Forecast verification depends on model, variable, lead time, weather pattern, location, reference and metric. A recent comparative preprint studies ensemble wind forecasts across thousands of stations; its scope cannot be substituted for this small temperature sample.
This activity does not rank all machine-learning and physics-based systems, establish global forecast skill, evaluate rainfall or warnings, or guide real decisions. Use official local forecasts and alerts for safety and planning.
14 // Questions people ask
Is AIFS an AI model and IFS a conventional model?
ECMWF describes AIFS as a machine-learning forecasting system and IFS as its Integrated Forecasting System. This comparison is only between these two named systems; both use weather analyses and neither label alone predicts which will be closer on a given date.
Why use archived forecast runs instead of a current forecast page?
A current forecast may be updated or stitched from newer model runs. A previous-runs archive preserves the selected forecast lead for dates that have already passed, allowing it to be matched with a reference.
Is ERA5 the actual weather?
ERA5 is a reanalysis that combines observations and a weather model to estimate past atmospheric conditions. It is useful as a shared reference, but it is not the same as an instrument reading at the chosen coordinate.
Why compare only one forecast lead and one variable?
Forecast skill varies with lead time and variable. Keeping a 24-hour temperature comparison fixed makes this classroom investigation interpretable; it does not answer how the systems perform for rain, wind or longer leads.
Can 14 dates show that AI forecasts are better?
No. Fourteen matched dates at one location support only a small descriptive comparison. A broader evaluation needs many locations, seasons, variables, forecast leads, reference data and version-aware statistical analysis.
Can you explain the investigation?
How do AI and conventional weather forecasts compare on the same dates? · Student Data Sheet
Question: For one chosen location and 14 matched dates, which of ECMWF AIFS or IFS has the lower mean absolute error for 24-hour-ahead daily maximum temperature against a shared ERA5 reference?
Hypothesis: If AIFS and IFS forecasts are compared at the same place, valid time and lead time, then one system may have a lower average error in this selected sample, or their errors may be similar, because forecast quality depends on the variable, lead, weather pattern, location, model version, reference and scoring method—not only on whether a system uses machine learning.
Materials
- teacher-approved browser or spreadsheet
- Open-Meteo Previous Model Runs archive
- ECMWF AIFS Single and IFS 0.25° model selections
- ERA5 hourly reanalysis reference
- one recorded location and time zone
- 14-date paired forecast worksheet or CSV
Safety before starting
- This small archive comparison is not an operational forecast. For severe weather, travel, outdoor activities, agriculture, or emergency decisions, follow current official local forecasts and alerts.
- Use public weather data and record the model, lead time, reference and missing values. Do not enter private location histories or personal information into an unapproved service.
Lab notes
Variables
Independent: Forecast system for each matched date · Dependent: Daily maximum-temperature error against one common reference
Keep constant: same coordinates and grid selection · same 14 valid dates · same local time zone and daily window · same 24-hour lead · same temperature variable and units · one shared ERA5 reference · no missing dates silently filled
Procedure
- Choose one location and a complete date window: With a teacher, choose one public location and record latitude, longitude, elevation if shown, and time zone. Select 14 consecutive dates that the archived AIFS and IFS data both cover. Use the Previous Model Runs archive rather than today's seamless forecast, which can switch models between updates. If either forecast is missing for a date, omit that date from both systems and record why; do not substitute a different lead time.
- Request matched forecasts: Select ECMWF AIFS 0.25° Single and ECMWF IFS 0.25° explicitly; do not use Best Match or a seamless blend. Retrieve 2-m air temperature at a fixed 24-hour lead for every hourly valid time in each date. Convert both series to the same local time zone and Celsius. Keep the original CSV/API export and the model names, version notes, request date and full query settings.
- Create one shared reference series: Retrieve hourly ERA5 reanalysis temperature for the same coordinates and valid dates from the Historical Weather API. For each date, calculate the maximum of the hourly forecast values and the maximum of the hourly ERA5 values using the identical local-day window. ERA5 blends observations with a weather model to reconstruct past conditions; label it reanalysis, not a local station measurement. A teacher may substitute a nearby official station only if both forecasts and station timestamps can be aligned consistently.
- Calculate paired errors: For each date, calculate absolute error = |forecast daily maximum − ERA5 daily maximum| for AIFS and IFS separately. Also calculate signed error = forecast − ERA5, so warm and cool biases remain visible. Check the dates, missing hours, units and daily-window boundaries before making a graph. Never compare one system's 24-hour lead with the other's 48-hour lead.
- Compare the sample without overclaiming: Calculate each model's MAE as the mean of its 14 absolute errors, and show the 14 paired rows as well as the averages. Count dates when AIFS has lower error, IFS has lower error or they tie within the recorded data precision. Plot the three daily maxima and a separate paired-error graph; identify outliers without deleting them. The result describes this selected location, time window, archived versions and ERA5 reference only.
Record your observations
| Date | AIFS daily max (°C) | IFS daily max (°C) | ERA5 daily max (°C) | AIFS absolute error (°C) | IFS absolute error (°C) | Missing-hour / source note |
|---|---|---|---|---|---|---|
Keep both forecasts on equal terms
| Design choice | AIFS column | IFS column | Shared rule |
|---|---|---|---|
Read the error measures
| Measure | How to calculate | What it shows |
|---|---|---|
Record each day before calculating
| Date | Both forecasts present? | Reference complete? | AIFS closer / IFS closer / tie | Weather or archive note |
|---|---|---|---|---|
Formula: Absolute error = |forecast − ERA5|; signed error = forecast − ERA5; MAE = sum of absolute errors ÷ matched dates
Answer key and expected pattern
ERA5 is a reanalysis reference formed from past observations and a weather model; it is not an exact station observation.
An average can hide dates when the other system was better; keep the paired daily errors and bias visible.
A short point-level temperature comparison cannot rank all AI and physics-based weather systems or assess warnings, rainfall, extremes or other lead times.
Remember: Match the location, valid time, lead and reference before comparing errors. A fair forecast comparison needs paired dates and one shared verification series.