How do data-center cooling designs trade water use against electricity?

01 // Question
In one published Michigan model, how does changing data-center cooling configuration shift annual electricity use and direct versus indirect water consumption?
This is a guided analysis of a published model scenario, not a measurement at a real data center. The outcome depends on the modeled climate, grid, cooling assumptions and water-accounting boundary.
02 // Variables
Independent
Cooling configuration in the published scenario- Water-cooled chiller
- Hybrid airside economizer / water-cooled chiller
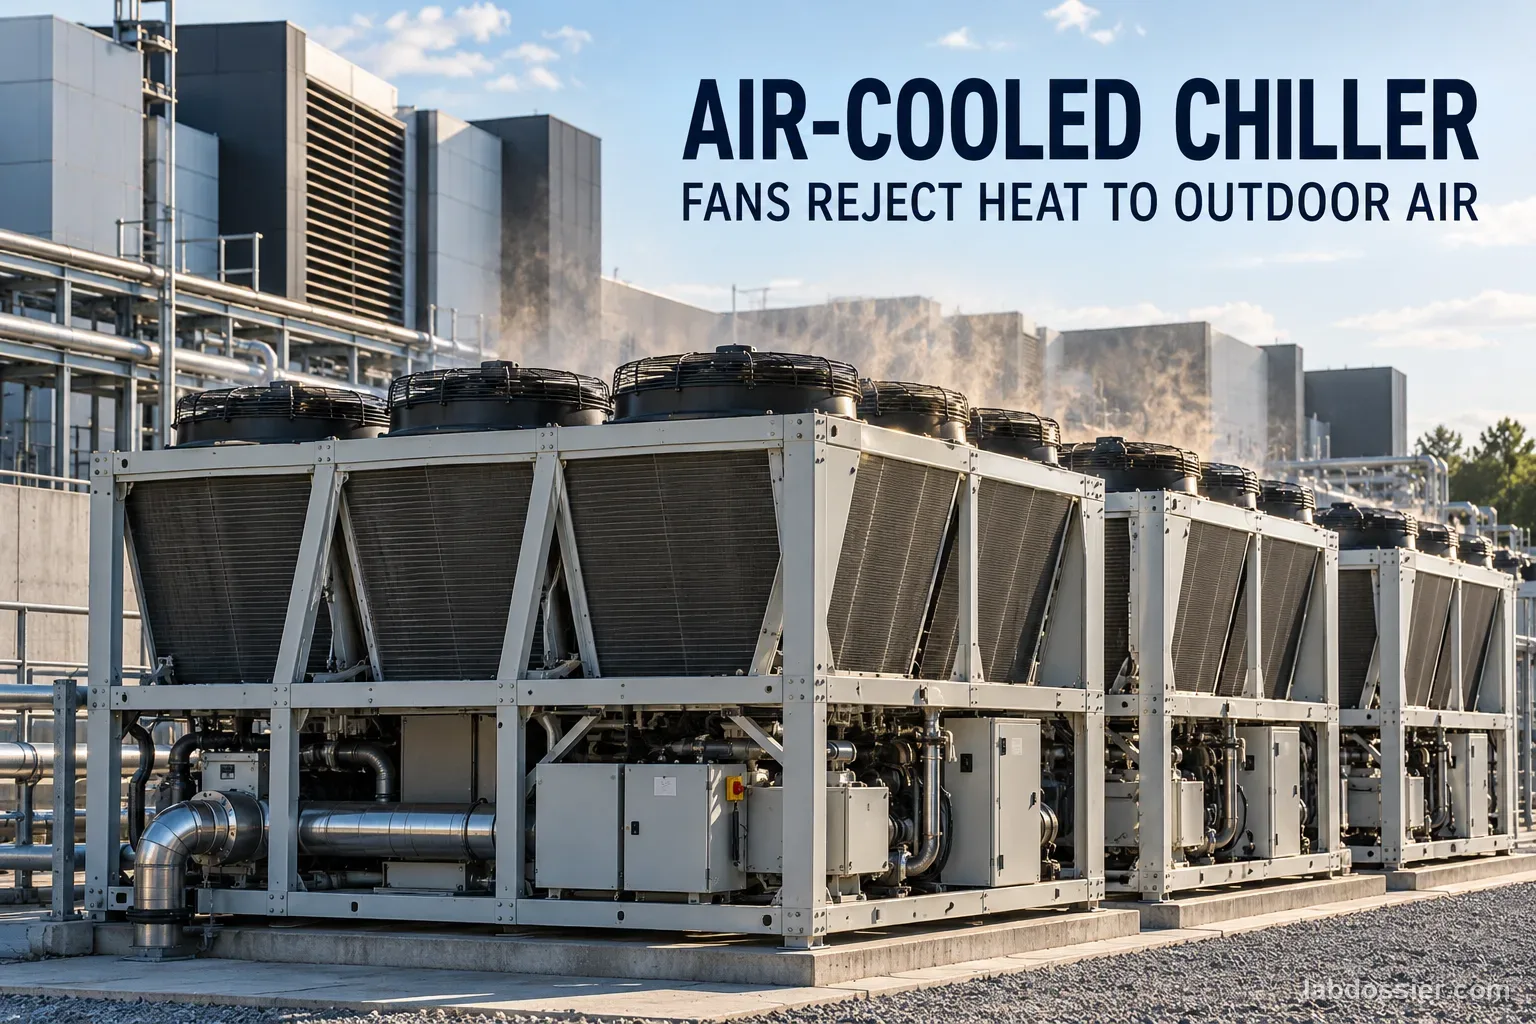
- Air-cooled chiller
Dependent
Published modeled annual facility electricity and water consumption- Facility electricity in TWh
- Direct facility water in million m³
- Indirect power-generation water in million m³
- Total modeled water and indirect share
03 // Hypothesis
IF a modeled design shifts heat rejection away from evaporative cooling toward air cooling, THEN direct on-site water may fall while facility electricity and indirect water from electricity generation may rise, BECAUSE fans and air-cooled chillers can require more electricity than evaporative cooling, and the water effects of that extra power depend on the generators serving the load.
04 // Procedure
1. Set the question and model boundary
Read the source note before comparing values. The article analyzes Scenario 1 in a September 2026 arXiv preprint: a hypothetical data center with a fixed 200 MW IT load in Oakland County, Southeast Michigan. The paper combines facility electricity and cooling assumptions with a modeled Michigan grid and generator water use. The numbers are modeled annual estimates, not meter readings or an audit of an operating facility.
2. Copy the three published configurations
Transcribe the source table exactly into the data table: facility electricity, direct facility cooling water, indirect water consumed in electricity generation, total water and indirect share. Keep the source units. Direct water occurs at the data center; indirect water in this study means water consumed by electricity generators. Construction, chip manufacturing and other supply-chain water are outside this model boundary.
3. Check totals and calculate matched changes
For each configuration, compare direct plus indirect water with the reported total. The source values are rounded: the hybrid components 3.20 + 3.98 equal 7.18 million m³, while the paper reports 7.19 million m³. Preserve the reported total and flag the rounding difference rather than silently changing a source value. Relative change (%) = (new value − water-cooled baseline) ÷ water-cooled baseline × 100. Keep negative values labeled as decreases.
4. Compare electricity and both water pathways
Calculate each configuration's percentage change from the water-cooled chiller baseline. Display facility electricity beside direct, indirect and total water; use a grouped table or clearly labeled chart with separate units. Do not combine TWh and million m³ on one unlabeled axis. Ask which configuration lowers site water, which raises or lowers modeled electricity, and where indirect water changes.
5. Inspect the hybrid result and its assumptions
The modeled hybrid system switches between an airside economizer and water-cooled chiller using temperature and humidity thresholds; the paper reports economizer operation for 25% of the year in this scenario. Ask how a different climate, humidity, grid dispatch, IT load profile or more detailed system controls could change the result. Note that the study selected upper endpoints of estimated midsize PUE/WUE ranges for its two fixed chiller cases; the authors say these are not values for specific real facilities.
6. Write a conclusion that fits the evidence
State the scenario, baseline, quantities and direction of each change. The paper's air-cooled case used much less modeled direct water but more electricity and indirect water than its water-cooled case; its modeled total water was lower for this Michigan/grid scenario. Do not recommend a design for every location from one model. Water volume alone also does not establish local water risk, which depends on where water is consumed and what is available there.
Materials // Prepare the bench
- published 2026 model paper and its Table 2
- calculator or spreadsheet
- four-variable comparison table
- graph paper or a labeled plotting tool
- teacher-approved browser
05 // Data table
| Scenario / cooling configuration | Facility electricity (TWh/year) | Direct water (million m³/year) | Indirect water (million m³/year) | Reported total water (million m³/year) | Indirect share (%) |
|---|---|---|---|---|---|
| Fixed 200 MW IT load — water-cooled chiller | 3.08 | 6.45 | 4.48 | 10.93 | 41.0 |
| Fixed 200 MW IT load — hybrid airside economizer / water-cooled chiller | 2.76 | 3.20 | 3.98 | 7.19 | 55.4 |
| Fixed 200 MW IT load — air-cooled chiller | 4.06 | 0.21 | 5.91 | 6.12 | 96.6 |
Calculate each change from the water-cooled baseline
| Configuration | Facility electricity change | Direct water change | Indirect water change | Total water change |
|---|---|---|---|---|
| Hybrid | (2.76 − 3.08) ÷ 3.08 × 100 | (3.20 − 6.45) ÷ 6.45 × 100 | (3.98 − 4.48) ÷ 4.48 × 100 | (7.19 − 10.93) ÷ 10.93 × 100 |
| Air-cooled | (4.06 − 3.08) ÷ 3.08 × 100 | (0.21 − 6.45) ÷ 6.45 × 100 | (5.91 − 4.48) ÷ 4.48 × 100 | (6.12 − 10.93) ÷ 10.93 × 100 |
Keep the system boundary visible
| Question | What this paper counts | What to avoid claiming |
|---|---|---|
| Where is direct water? | Cooling consumption at the data-center facility | That it includes every water withdrawal or return flow |
| Where is indirect water? | Water consumed by electricity generators responding to the modeled load | That it all occurs at the data-center site |
| What does liquid cooling mean? | How heat moves away from servers | That it identifies the facility's final heat-rejection system |
| What is outside scope? | Server/chip manufacturing and other supply-chain water | That the total is a full life-cycle water footprint |
Check before interpreting a modeled comparison
| Review question | Yes / no / note |
|---|---|
| Is the IT load held at 200 MW across the three rows? | |
| Are facility and generator water reported separately? | |
| Are all three values labeled as modeled annual estimates? | |
| Does the conclusion name Michigan and the paper's assumptions? | |
| Does it avoid treating water volume alone as local water risk? |
Formula Relative change (%) = (configuration value − water-cooled baseline value) ÷ water-cooled baseline value × 100; direct + indirect = modeled total (allowing for source rounding)
06 // What to expect
The modeled air-cooled case sharply lowers direct facility water while increasing electricity and indirect generator water; for this paper's Michigan case, reported total modeled water also falls.
The hybrid case has the lowest modeled facility electricity and indirect water among these three rows, while its reported total water is above the air-cooled case and below the water-cooled case.
Results are sensitive to modeled facility efficiency, cooling controls, climate, grid response and the water boundary; they do not determine a universal best cooling design or local water risk.
07 // Lab notes
08 // Remember
Cooling changes can move water use between the data center and the power grid. Compare electricity, direct water, indirect water and place together.
09 // Read the published model scenario
The source's first scenario compares three annual cooling configurations for the same hypothetical data center in Oakland County, Michigan, with a fixed 200 MW IT load. The paper uses modeled facility performance and a modeled electricity grid. Its values are estimates from that chosen scenario, not operational readings from an existing data center. The two fixed chiller cases use upper endpoints of estimated midsize-facility PUE/WUE ranges; the authors explicitly discuss the limits of those assumptions.
The paper reports 3.08 TWh facility electricity for the water-cooled chiller, 2.76 TWh for the hybrid and 4.06 TWh for the air-cooled chiller. The same-IT-load comparison is useful because the cooling configuration is the feature being changed in the model. It does not mean all real facilities would draw those amounts.

10 // Separate the two water pathways
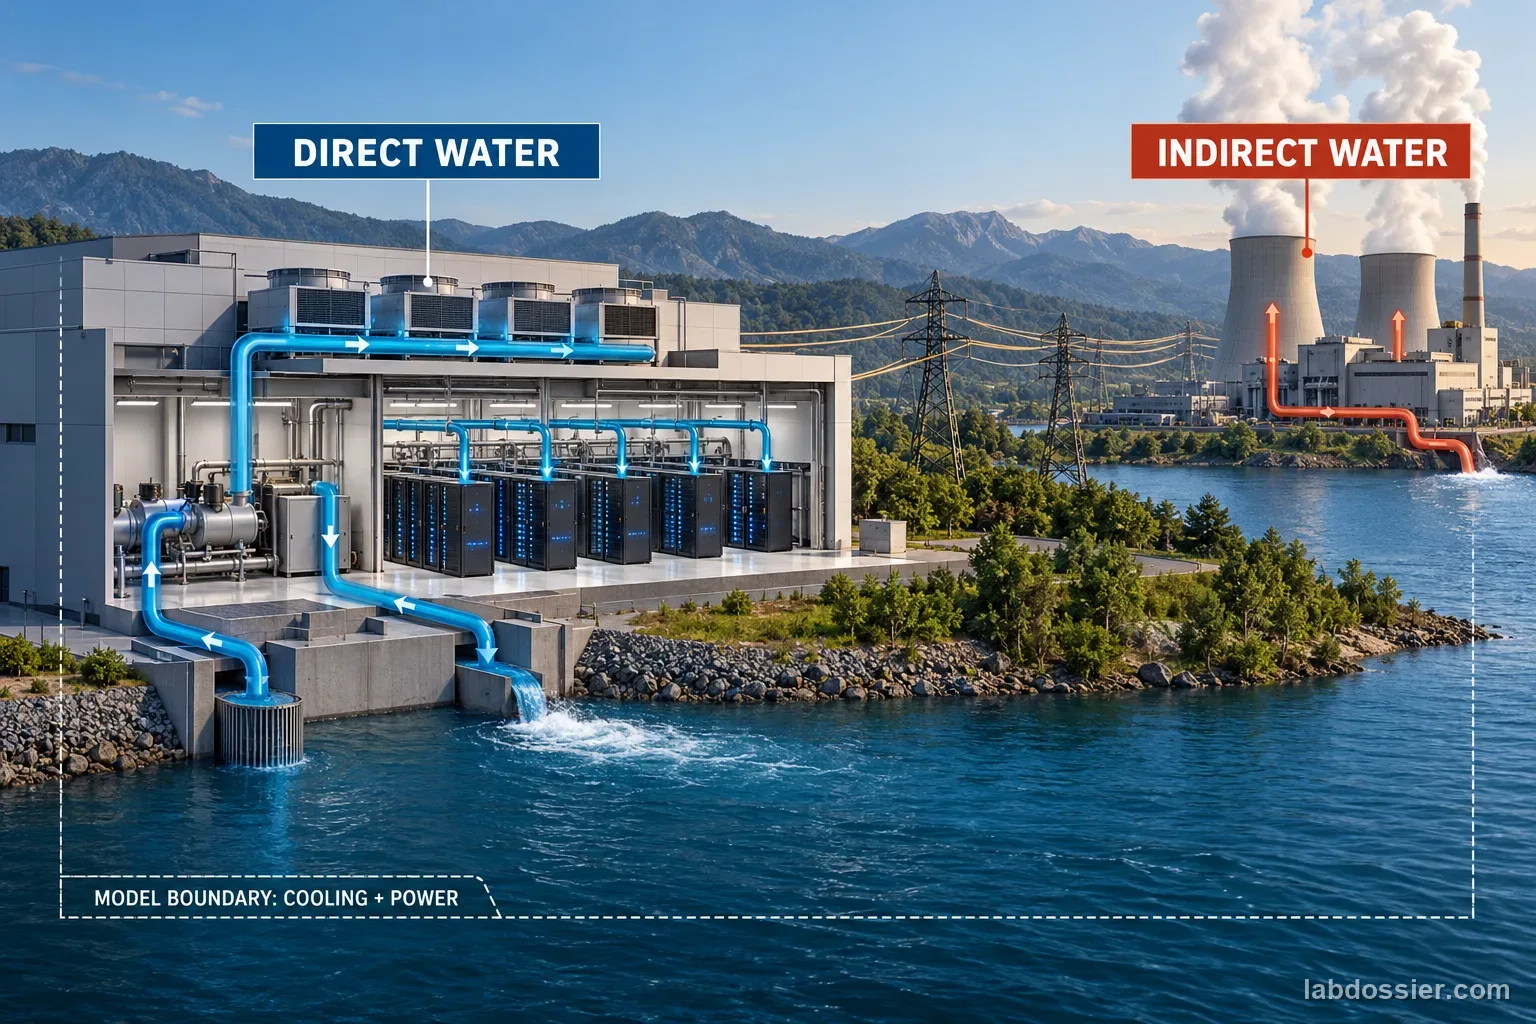
Direct water is consumed at the facility, mainly through cooling. Indirect water in this paper is consumed at power generators that respond to the modeled electricity load. The water-cooled, hybrid and air-cooled rows report respectively 6.45, 3.20 and 0.21 million m³/year of direct water; indirect water is 4.48, 3.98 and 5.91 million m³/year. The air-cooled model therefore moves a much larger share of the water footprint off site, even as its total modeled water is lower in this case.
The term liquid cooling describes heat transfer from server components; it does not specify how the facility ultimately rejects heat. The California Energy Commission's report documents a pre-commercial liquid-cooling demonstration at two full-scale California data centers. That real-world project is useful engineering context, but it is not the same three-way water accounting scenario and its reported technology estimates should not be presented as universal outcomes.
11 // Calculate matched changes
Use each published quantity as a separate column. Relative change (%) = (configuration value − water-cooled baseline) ÷ water-cooled baseline × 100. From the paper's rounded values, the hybrid is about 10% lower in facility electricity, 50% lower in direct water, 11% lower in indirect water and 34% lower in reported total water than the water-cooled baseline. The air-cooled case is about 32% higher in facility electricity, 97% lower in direct water, 32% higher in indirect water and 44% lower in reported total water.
These are classroom recalculations of the paper's rounded model outputs, not new observations. For the hybrid row, the rounded components sum to 7.18 million m³ while the source reports 7.19 million m³. Retain both source components and the reported total, and identify rounding as the reason they do not exactly add.
12 // Inspect the hybrid result and its assumptions
The paper's hybrid configuration switches between airside economizer and water-cooled chiller operation using daily temperature and relative humidity thresholds. It selected the air-cooled mode on 25% of modeled days in this scenario; the remainder used the chiller mode. Its modeled facility electricity and indirect water are the lowest among these three configurations, while reported total water remains above the air-cooled case.
That result depends on a specific place, selected performance-range endpoints, a simplified control rule, modeled generator dispatch and available source datasets. The authors note grid-resolution, data-gap and water-source mapping limits. The study also excludes server and chip manufacturing and other supply-chain water, so the reported total is not a full life-cycle footprint.

13 // Interpret the tradeoff without overclaiming
A design that reduces on-site water can increase electricity demand, shifting part of its water use to power generators. Whether that shift lowers total water or local water stress depends on the cooling system, climate, grid, water source and watershed conditions. Consumption is also different from withdrawal: consumed water is not returned to the immediate water environment, while withdrawal measures the amount removed.
Conclude only what the reported Michigan model supports. Do not infer a universal winner or recommend a real facility design from this three-row table. Annual water volume alone cannot show which community faces greater risk; local availability, existing demand, return flows and the location of both facilities and generators matter.
14 // Questions people ask
Are the numbers measured at a real data center?
No. Scenario 1 is a computational model for a hypothetical fixed 200 MW IT facility in Oakland County, Michigan. It combines facility performance assumptions with a model of the electricity grid and generator water consumption.
What is the difference between direct and indirect water?
In this study, direct water is consumed at the data center, mainly for cooling. Indirect water is consumed at electricity generators supplying the facility's power. The two can occur in different watersheds.
Does air cooling always use less total water?
This paper's air-cooled configuration has lower total modeled water than its water-cooled case, but it also uses more electricity and indirect water. Different climates, equipment, grid mixes and operating controls can produce different outcomes.
Is server liquid cooling the same as water-cooled facility cooling?
No. Liquid cooling describes how heat transfers away from server components. Separate equipment still rejects that heat from the facility, and that system may use towers, dry coolers or other arrangements.
Does lower water consumption mean lower local water risk?
Not by itself. Risk depends on where water is consumed, how much is available, existing uses and whether the figure describes withdrawals or consumption. This paper models location-specific depletion; a classroom comparison of annual volumes alone cannot replace that analysis.
Can you explain the investigation?
How do data-center cooling designs trade water use against electricity? · Student Data Sheet
Question: In one published Michigan model, how does changing data-center cooling configuration shift annual electricity use and direct versus indirect water consumption?
Hypothesis: If a modeled design shifts heat rejection away from evaporative cooling toward air cooling, then direct on-site water may fall while facility electricity and indirect water from electricity generation may rise, because fans and air-cooled chillers can require more electricity than evaporative cooling, and the water effects of that extra power depend on the generators serving the load.
Materials
- published 2026 model paper and its Table 2
- calculator or spreadsheet
- four-variable comparison table
- graph paper or a labeled plotting tool
- teacher-approved browser
Safety before starting
- This activity is a classroom analysis of published model estimates. Do not build, open, alter, or service data-center electrical, refrigeration, water, or pressure systems.
- Keep modeled figures labeled as estimates and do not treat this simplified comparison as engineering advice for a real facility or as a local water-risk assessment.
Lab notes
Variables
Independent: Cooling configuration in the published scenario · Dependent: Published modeled annual facility electricity and water consumption
Keep constant: same hypothetical 200 MW IT load · same Oakland County, Michigan case · one model boundary and annual period · source-reported cooling assumptions · identical units and comparison baseline
Procedure
- Set the question and model boundary: Read the source note before comparing values. The article analyzes Scenario 1 in a September 2026 arXiv preprint: a hypothetical data center with a fixed 200 MW IT load in Oakland County, Southeast Michigan. The paper combines facility electricity and cooling assumptions with a modeled Michigan grid and generator water use. The numbers are modeled annual estimates, not meter readings or an audit of an operating facility.
- Copy the three published configurations: Transcribe the source table exactly into the data table: facility electricity, direct facility cooling water, indirect water consumed in electricity generation, total water and indirect share. Keep the source units. Direct water occurs at the data center; indirect water in this study means water consumed by electricity generators. Construction, chip manufacturing and other supply-chain water are outside this model boundary.
- Check totals and calculate matched changes: For each configuration, compare direct plus indirect water with the reported total. The source values are rounded: the hybrid components 3.20 + 3.98 equal 7.18 million m³, while the paper reports 7.19 million m³. Preserve the reported total and flag the rounding difference rather than silently changing a source value. Relative change (%) = (new value − water-cooled baseline) ÷ water-cooled baseline × 100. Keep negative values labeled as decreases.
- Compare electricity and both water pathways: Calculate each configuration's percentage change from the water-cooled chiller baseline. Display facility electricity beside direct, indirect and total water; use a grouped table or clearly labeled chart with separate units. Do not combine TWh and million m³ on one unlabeled axis. Ask which configuration lowers site water, which raises or lowers modeled electricity, and where indirect water changes.
- Inspect the hybrid result and its assumptions: The modeled hybrid system switches between an airside economizer and water-cooled chiller using temperature and humidity thresholds; the paper reports economizer operation for 25% of the year in this scenario. Ask how a different climate, humidity, grid dispatch, IT load profile or more detailed system controls could change the result. Note that the study selected upper endpoints of estimated midsize PUE/WUE ranges for its two fixed chiller cases; the authors say these are not values for specific real facilities.
- Write a conclusion that fits the evidence: State the scenario, baseline, quantities and direction of each change. The paper's air-cooled case used much less modeled direct water but more electricity and indirect water than its water-cooled case; its modeled total water was lower for this Michigan/grid scenario. Do not recommend a design for every location from one model. Water volume alone also does not establish local water risk, which depends on where water is consumed and what is available there.
Record your observations
| Scenario / cooling configuration | Facility electricity (TWh/year) | Direct water (million m³/year) | Indirect water (million m³/year) | Reported total water (million m³/year) | Indirect share (%) |
|---|---|---|---|---|---|
Calculate each change from the water-cooled baseline
| Configuration | Facility electricity change | Direct water change | Indirect water change | Total water change |
|---|---|---|---|---|
Keep the system boundary visible
| Question | What this paper counts | What to avoid claiming |
|---|---|---|
Check before interpreting a modeled comparison
| Review question | Yes / no / note |
|---|---|
Formula: Relative change (%) = (configuration value − water-cooled baseline value) ÷ water-cooled baseline value × 100; direct + indirect = modeled total (allowing for source rounding)
Answer key and expected pattern
The modeled air-cooled case sharply lowers direct facility water while increasing electricity and indirect generator water; for this paper's Michigan case, reported total modeled water also falls.
The hybrid case has the lowest modeled facility electricity and indirect water among these three rows, while its reported total water is above the air-cooled case and below the water-cooled case.
Results are sensitive to modeled facility efficiency, cooling controls, climate, grid response and the water boundary; they do not determine a universal best cooling design or local water risk.
Remember: Cooling changes can move water use between the data center and the power grid. Compare electricity, direct water, indirect water and place together.