What can and cannot be inferred from a telescope's exoplanet spectrum?
01 // Question
Which atmospheric claims are supported by a noisy spectrum, and which depend on assumptions or evidence the spectrum does not provide?
The classroom spectra are invented for practice. A spectrum samples particular wavelengths and observing geometries; it is not a photograph, a complete planetary map or a direct life detector.
02 // Variables
Independent
Synthetic atmospheric interpretation case and its measurement uncertainty- clear molecule-like absorption features
- flat spectrum within large uncertainty
- similar spectrum compatible with more than one model
Dependent
Strength and scope of the claim a reader can justify from the plotted spectral evidence- which wavelength features exceed their uncertainty
- whether multiple atmospheric models remain plausible
- what additional observation or context would reduce ambiguity
03 // Hypothesis
IF a spectrum has repeatable absorption features that exceed the stated uncertainties and align with known molecular bands, THEN a cautious claim about atmospheric molecules will be better supported than for a flat or ambiguous spectrum, BECAUSE molecules absorb at characteristic wavelengths, but clouds, temperature, abundance, stellar effects and instrument response can change or imitate the observed feature pattern.
04 // Procedure
1. Label the exercise as synthetic
Use the three teaching cases and values in the table; they are invented, not measurements from JWST or a named exoplanet. Read the uncertainty column before naming any feature. The task is to practice evidence strength and alternative explanations, not to identify a real atmosphere from classroom numbers.
2. Connect the observation to its geometry
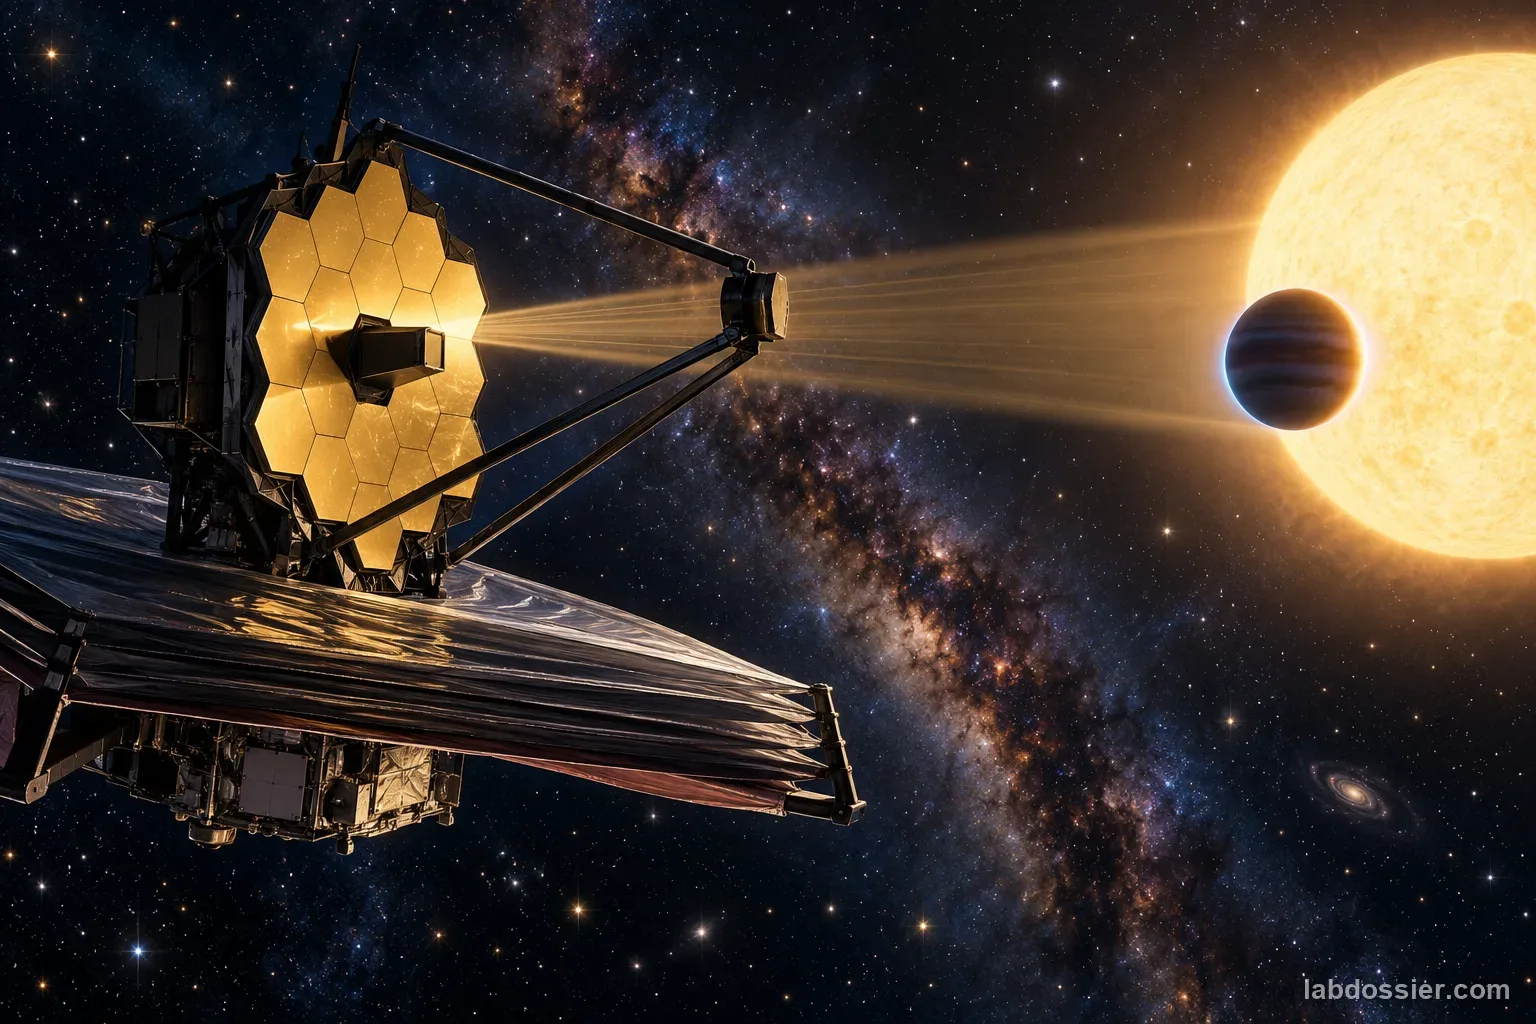
For a transmission spectrum, compare starlight measured outside transit with starlight filtered through the planet's atmospheric limb during transit. Different wavelengths can be blocked by different amounts. The result primarily samples the terminator region along the observed chord; it does not directly map the whole atmosphere, surface, oceans, weather or night side.
3. Check whether features exceed uncertainty
Plot normalized transit depth against wavelength with the stated uncertainty range. Mark a feature only if its shape and size are distinguishable from the uncertainty and baseline variation, and look for a coherent pattern across more than one wavelength. Do not treat a single point as a molecule identification. Compare the whole feature pattern with reference spectra and the instrument's wavelength coverage.
4. Compare more than one atmosphere model
Use the three cases to test whether a similar-looking spectrum could fit different atmospheric stories. A muted or nearly flat spectrum may arise from high clouds or haze, a small atmospheric scale height or molecular weight, weak absorption, low signal-to-noise, limited wavelength coverage, or little/no atmosphere. Model assumptions and priors affect the retrieval; a good fit is not proof that only one composition exists.
5. Read recent JWST evidence in context
In July 2026, NASA reported that Webb's NIRSpec spectra revealed carbon-monoxide absorption from directly imaged Beta Pictoris d; additional MIRI observations found water vapor and methane. Spectral lines helped separate the planet from dust and supported estimates of its motion, while separate imaging observations independently confirmed the planet. That is a specific young giant-planet case, not a recipe that every spectrum alone confirms every world.
6. Write a claim with the missing evidence
State the feature observed, the wavelengths and uncertainty, the retrieval assumptions, and at least one plausible alternative. Then distinguish composition from climate, surface conditions and biology. A gas detection alone does not establish liquid surface water, habitability or life; those conclusions require multiple independent lines of evidence and a physically plausible planetary and stellar context.
Materials // Prepare the bench
- the three synthetic interpretation cases in the article
- printed or digital wavelength plot
- colored pencils or spreadsheet plotting tool
- claim-evidence-limit worksheet
05 // Data table
| Synthetic case | Illustrative feature pattern | Stated uncertainty | Strongest defensible claim | One live alternative |
|---|---|---|---|---|
| A — structured features | Several repeatable depressions align with reference bands | Small enough to resolve the broad pattern | A molecule or molecule set is supported under stated model assumptions | Stellar contamination or retrieval assumptions still need evaluation |
| B — nearly flat | No clear feature exceeds the uncertainty | Comparable to or larger than the shallow feature pattern | This observation does not distinguish a strong feature from a flat spectrum | Clouds, haze, low scale height, weak signal or little atmosphere |
| C — model overlap | One broad feature can be fit by two different model families | Both fits remain within the stated uncertainty | At least two explanations remain plausible with this wavelength range | Additional wavelength coverage or another observing method may help |
Observation, interpretation and overclaim are different steps
| Step | Careful statement | What it does not establish by itself |
|---|---|---|
| Observed spectrum | Transit depth varies with wavelength in this dataset | A particular molecule unless features and uncertainties support it |
| Atmospheric retrieval | One or more atmospheric models fit the spectrum under stated assumptions | A unique composition if different models fit similarly |
| Planetary context | Temperature, gravity, host-star activity and orbital context constrain interpretation | Surface oceans, habitability or Earth-like conditions from composition alone |
| Life-related claim | A possible gas or chemical disequilibrium motivates follow-up in context | Life from one gas or one spectrum without abiotic alternatives |
A transmission spectrum sees a narrow atmospheric path
| Method | Light measured | Main information | Key limit |
|---|---|---|---|
| Transmission spectroscopy | Starlight filtered through the planet's limb during transit | Wavelength-dependent opacity along the observed terminator chord | Clouds, haze, stellar effects and 3D limb differences can complicate retrieval |
| Direct imaging spectroscopy | Light spatially separated from the host star | Atmospheric fingerprint, temperature/composition clues, and sometimes motion | Contrast, dust, instrumental artifacts and model assumptions still matter |
| Thermal emission or phase curve | Planet heat at orbital phases or day/night views | Temperature structure and emitted-light spectra for suitable targets | Not a global map or a surface measurement for every exoplanet |
06 // What to expect
The structured synthetic spectrum supports a more specific molecule-related claim than the flat case only if features exceed their stated uncertainty and remain coherent with reference bands.
A flat or overlapping spectrum can leave multiple atmospheric explanations open; nondetection is not automatically evidence that no atmosphere exists.
Even an atmospheric molecule detection cannot by itself establish climate, surface habitability or life. State method, target geometry, wavelength coverage, uncertainty and model assumptions.
07 // Lab notes
- The activity table is a qualitative synthetic exercise. Do not quote its entries as JWST measurements, detection significance, chemical abundance or a real atmospheric retrieval.
- Transmission spectra sample the planet's observed limb and can average morning/evening regions; clouds, hazes, stellar heterogeneity, instrument systematics and wavelength coverage affect interpretation.
- A molecule detection is not evidence of life by itself. Consider abiotic chemistry, stellar radiation, temperature, pressure, context and independent observations before any habitability claim.
08 // Remember
A spectrum can hint at atmospheric ingredients, but the answer depends on which wavelengths were measured and which models still fit. Describe the spectral feature and uncertainty first, compare plausible retrieval models second, and separate those results from claims about a planet's surface or life.
09 // A spectrum reveals a pattern in light
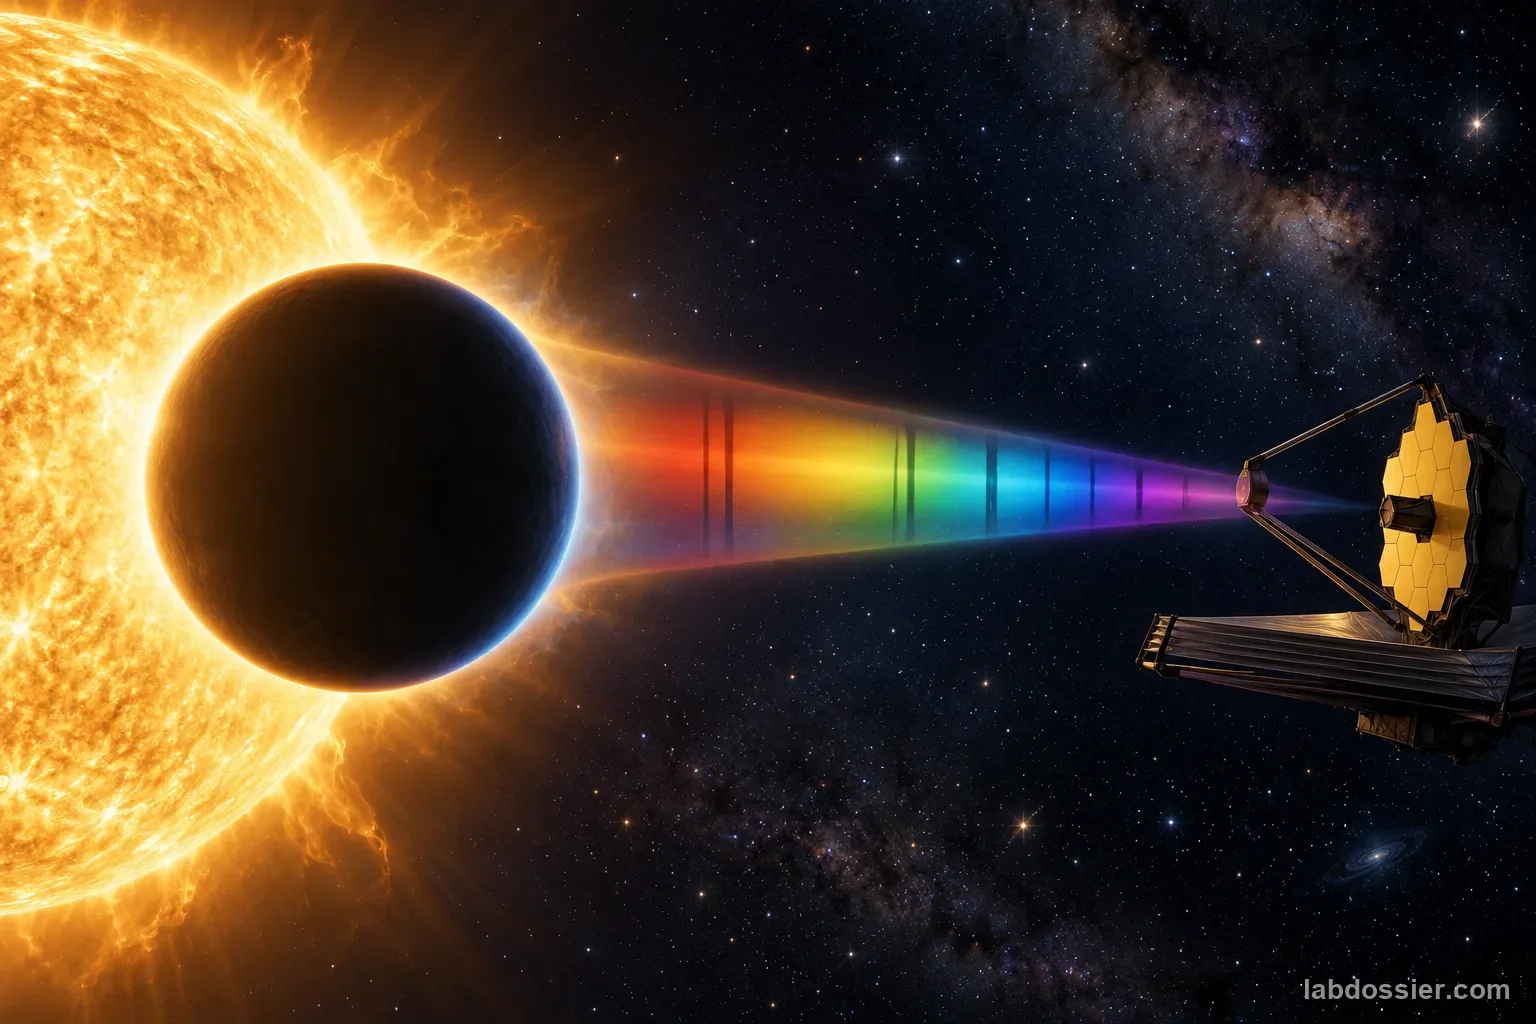
A spectrograph separates light by wavelength. In transmission spectroscopy, researchers compare the star's spectrum with starlight filtered through a transiting planet's atmosphere. Molecules absorb light at characteristic wavelengths, so a repeated feature pattern can support a composition inference when the signal is resolved and the data quality is sufficient.
The measured spectrum is an observation; a molecular abundance or atmospheric structure is an interpretation produced by comparing the observation with physics-based models. The distinction matters because different assumptions can sometimes fit the same limited data.
10 // Connect the observation to its geometry
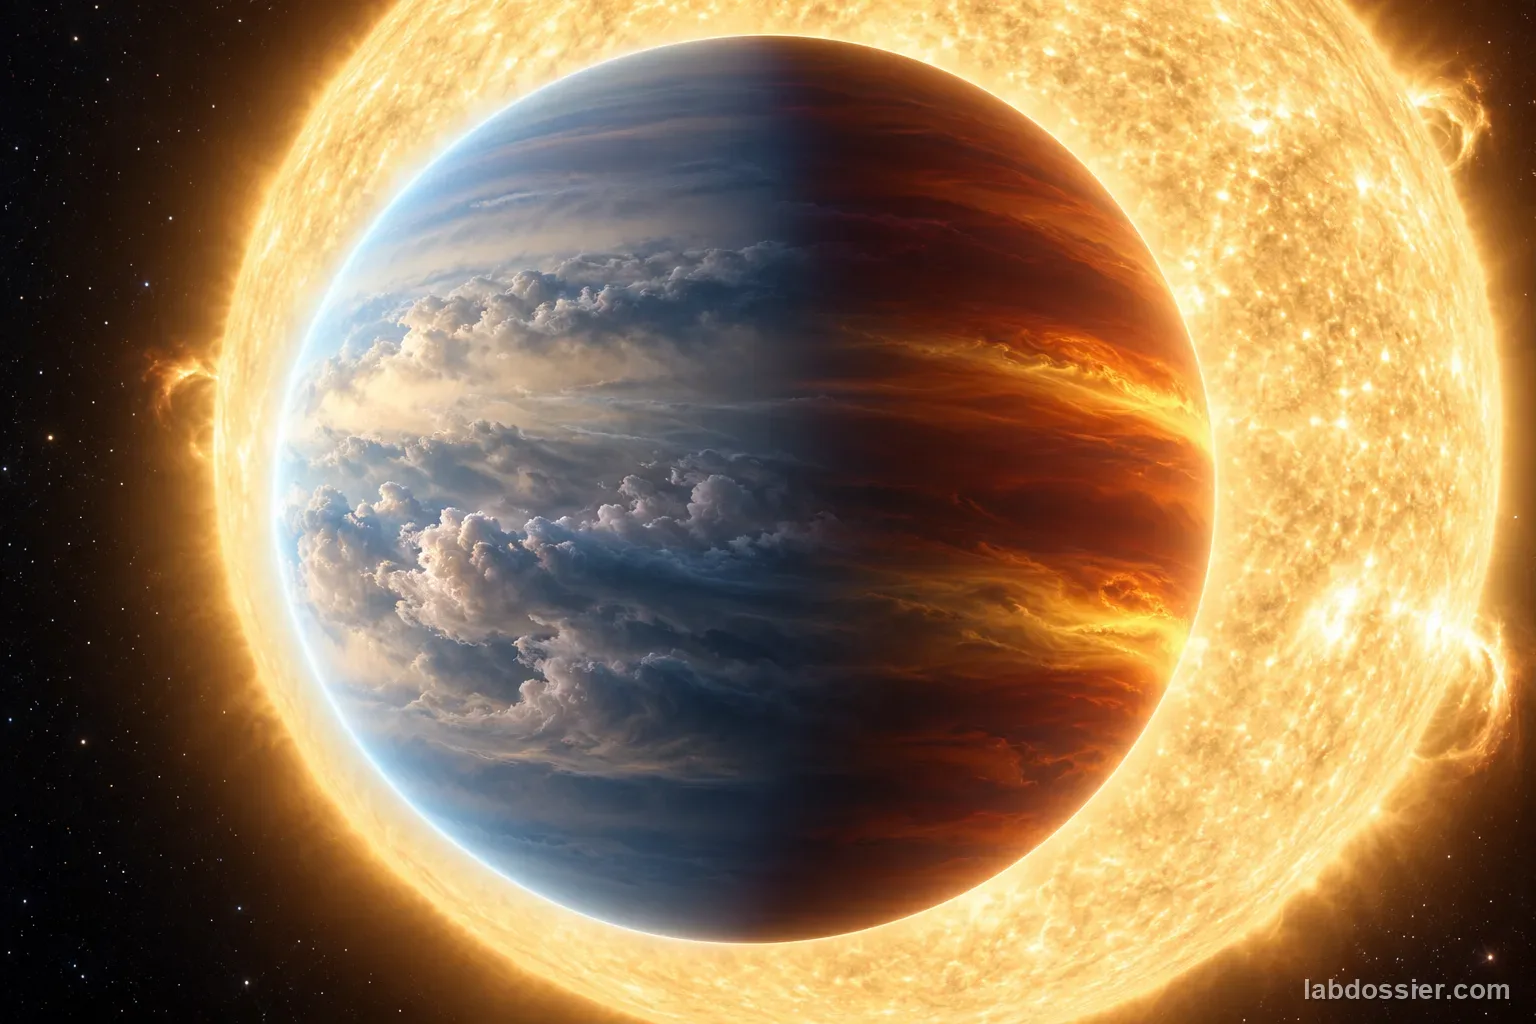
Transmission spectroscopy samples the thin ring around a planet's terminator, where its atmosphere filters starlight during transit. It does not look straight through the center of the planet or directly sample the surface. A transit can average portions of the morning and evening limbs, and those regions can have different clouds or temperatures.
Other techniques answer different questions. Direct imaging separates a planet's light spatially from the star; reflected or emitted light can reveal atmospheric information and motion. Thermal phase curves compare heat at orbital phases for very hot, short-period targets. None is automatically a complete map of every atmospheric layer.
11 // Check whether features exceed uncertainty
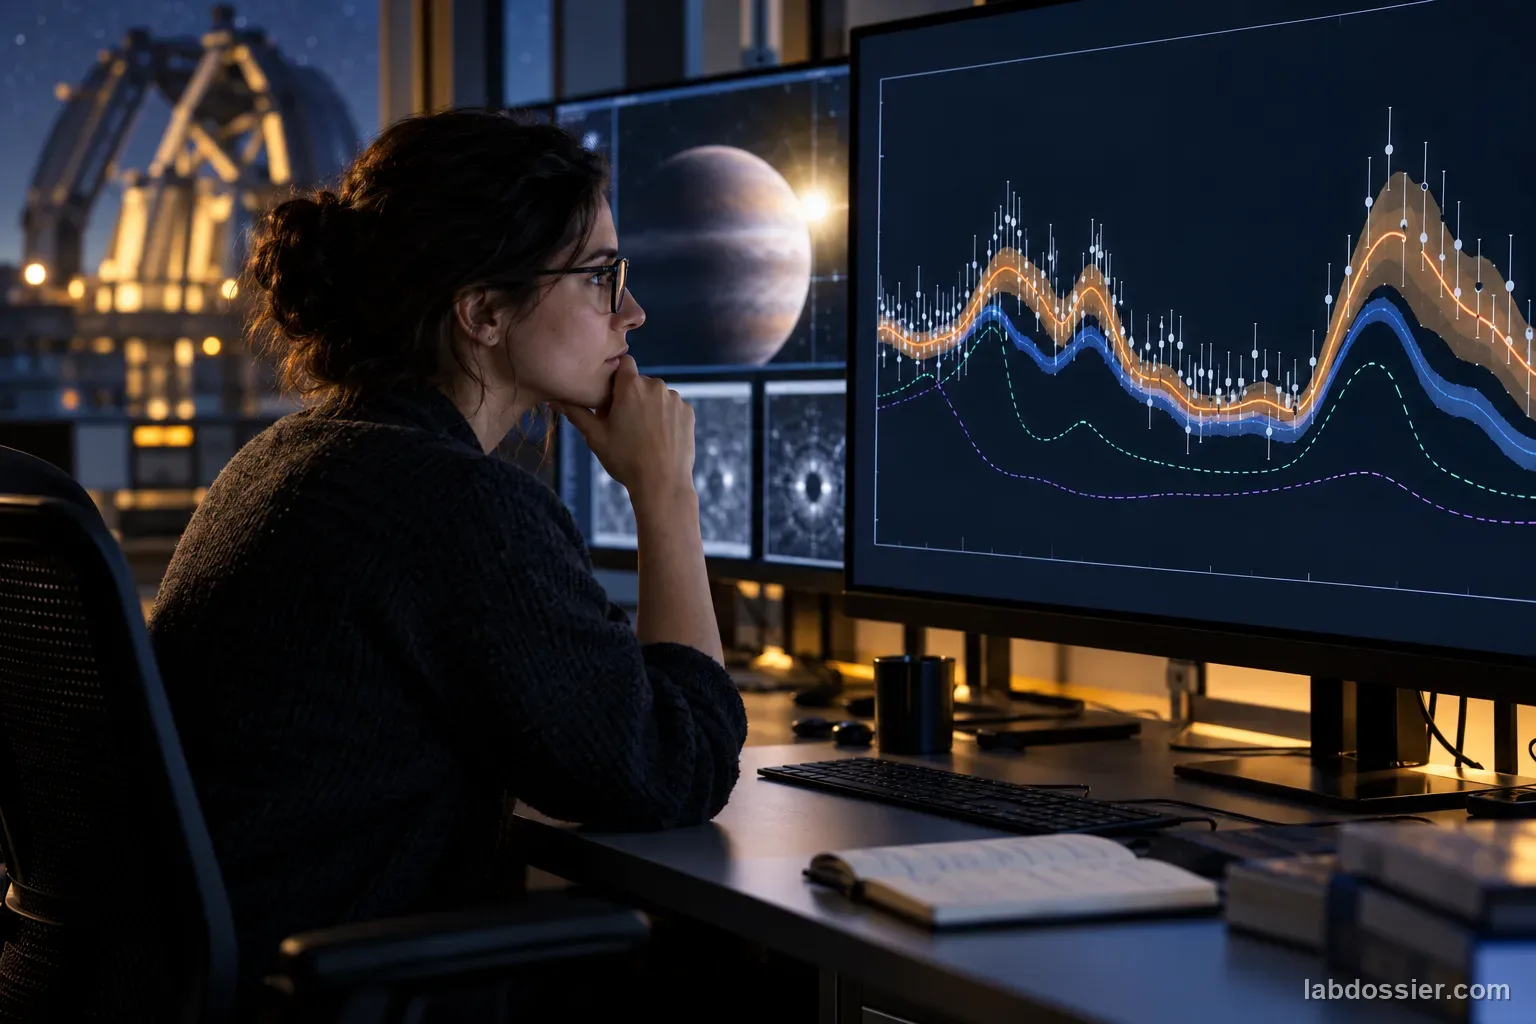
In the synthetic examples, compare the feature shape to its uncertainty range and baseline. A broad, coherent pattern across several wavelengths is more informative than an isolated low point. Ask which instrument range includes each feature, whether observations repeat, and whether stellar spots, faculae or instrument systematics could affect the result.
A nondetection must be described relative to sensitivity and the model tests. A spectrum that is featureless at one precision can still be consistent with several possible atmospheres. It does not prove that the planet has no atmosphere or that a molecule is absent at every altitude.
12 // Compare more than one atmosphere model
Atmospheric retrieval searches model combinations that may vary gas abundance, temperature structure, clouds, haze, gravity and other parameters. Cloud decks can mute deeper molecular features; a large mean molecular mass can shrink the atmospheric scale height; wavelength coverage and uncertainties constrain what the data can distinguish. A best fit is conditional on the model family and its assumptions.
NASA's JWST transmission spectrum for rocky planet LHS 475 b is a useful caution: the featureless result ruled out some specific scenarios but remained consistent with a high cloud deck, a tenuous atmosphere or no appreciable atmosphere. The spectrum constrains possibilities without choosing one of those explanations uniquely.
13 // Read recent JWST evidence in context
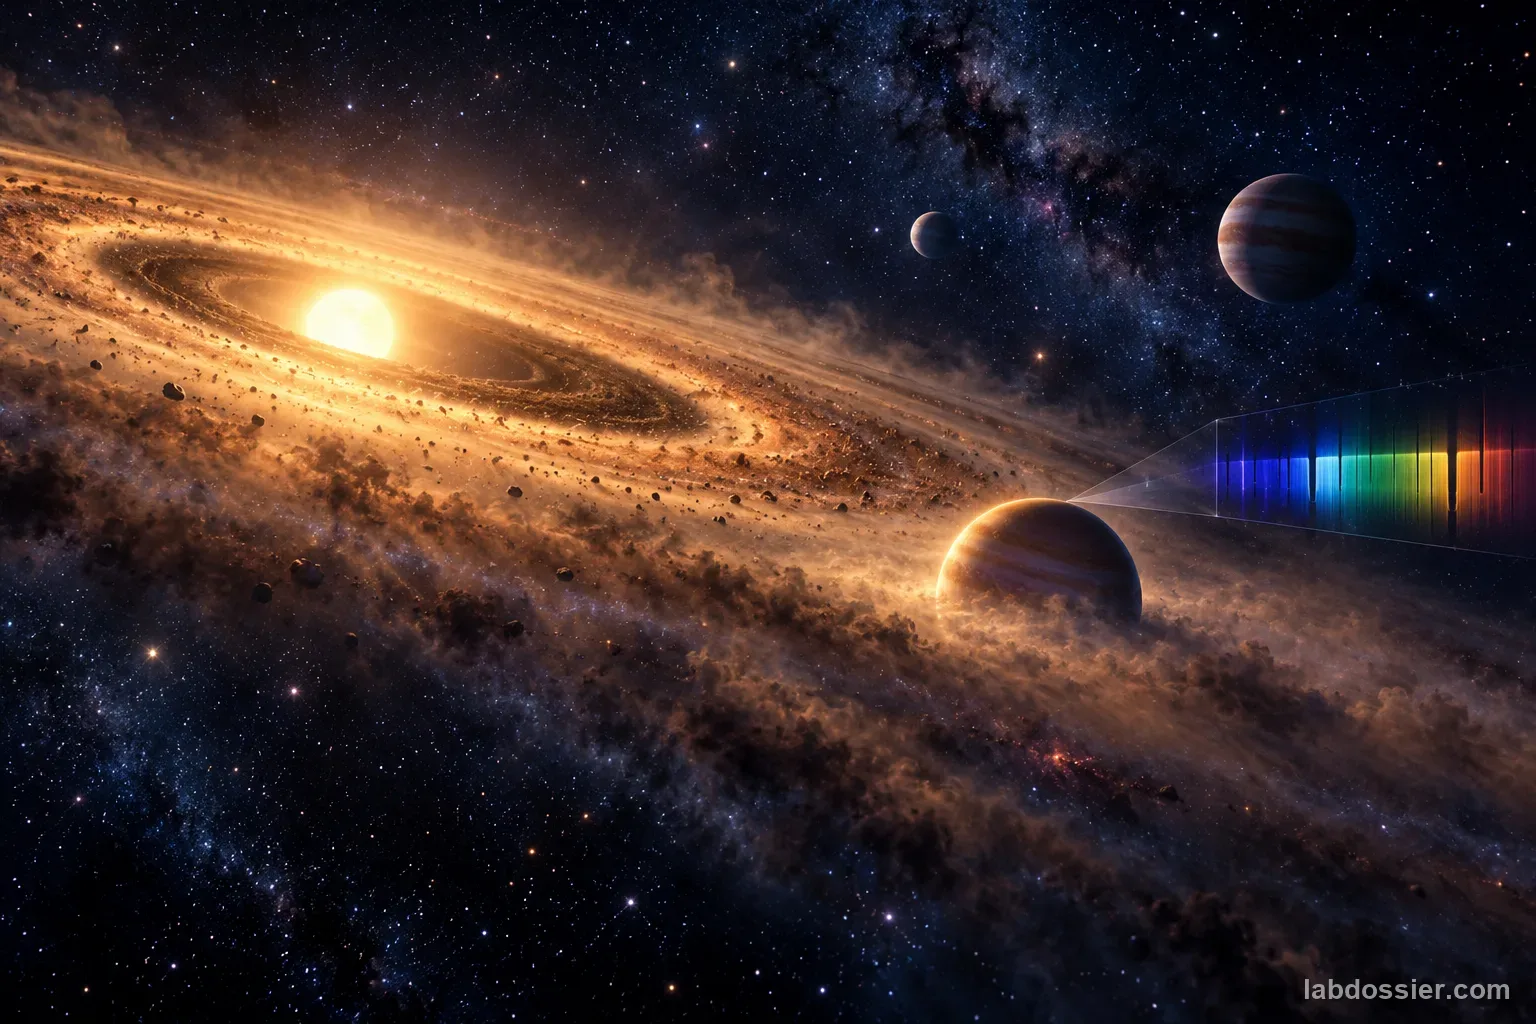
NASA's July 2026 report on Beta Pictoris d describes a different method from transmission spectroscopy. The planet was identified in Webb/NIRSpec integral-field data through a carbon-monoxide spectral fingerprint within a dusty debris disk. Follow-up MIRI spectra found water vapor and methane; spectroscopy also helped estimate motion, while separate imaging observations independently confirmed the planet.
This is an important example of spectroscopy doing more than naming molecules: it helped separate a faint planet from disk dust and supported its physical interpretation. The evidence remains target-specific. A carbon-monoxide signature, like any molecule, is not a general indicator of biology or habitability.
14 // Write a claim with the missing evidence
Use four sentences in the conclusion: describe the observed feature and wavelength range; state the uncertainty and observation geometry; name a model assumption or alternative; and list one follow-up that could distinguish the alternatives. Label synthetic case results as practice rather than observations.
Do not infer a surface ocean, Earth-like climate, habitability or life from one molecule or one spectrum. Those claims depend on multiple atmospheric gases, pressure and temperature constraints, the host star, photochemistry, possible abiotic sources, planet formation and independent observations.
15 // Questions people ask
Can a spectrum identify a gas in an exoplanet atmosphere?
A pattern of absorption or emission features can support the presence of molecules when it matches known spectral behavior and is distinguishable from measurement uncertainty. Retrieval models, instrumental effects and competing explanations still matter.
Does a flat spectrum mean the planet has no atmosphere?
Not necessarily. High clouds or haze, a small atmospheric scale height, weak features, limited wavelength coverage, stellar effects or measurement uncertainty can make a spectrum look featureless. NASA's LHS 475 b study found a flat spectrum consistent with several different scenarios, including an atmosphere or none.
What did Webb's 2026 Beta Pictoris d result show?
NASA reported carbon-monoxide features in Webb/NIRSpec data from the directly imaged planet; follow-up MIRI data detected water vapor and methane. The spectrum helped distinguish it from the dusty disk and provided clues about its chemistry and motion, while separate imaging work also confirmed the planet.
Does finding water vapor mean an exoplanet is habitable?
No. Water vapor in an atmosphere does not by itself establish surface liquid water, suitable temperatures or pressure, or life. The planet's orbit, star, atmosphere structure and other evidence must be considered.
Can one transit represent the whole planet's weather?
No. Transmission spectroscopy samples the limb region along the transit path. NASA's 2026 WASP-94A b study illustrates that morning and evening regions can differ in cloudiness, so a single averaged spectrum may hide spatial structure.
16 // Keep going
Can you explain the investigation?
What can and cannot be inferred from a telescope's exoplanet spectrum? · Student Data Sheet
Question: Which atmospheric claims are supported by a noisy spectrum, and which depend on assumptions or evidence the spectrum does not provide?
Hypothesis: If a spectrum has repeatable absorption features that exceed the stated uncertainties and align with known molecular bands, then a cautious claim about atmospheric molecules will be better supported than for a flat or ambiguous spectrum, because molecules absorb at characteristic wavelengths, but clouds, temperature, abundance, stellar effects and instrument response can change or imitate the observed feature pattern.
Materials
- the three synthetic interpretation cases in the article
- printed or digital wavelength plot
- colored pencils or spreadsheet plotting tool
- claim-evidence-limit worksheet
Safety before starting
- Mark every synthetic spectrum and model curve as instructional. Do not quote classroom values as telescope measurements or assign a molecule to a real planet from the simplified exercise.
- For any real spectrum, record the target, observation, wavelength range, instrument, data reduction and retrieval model. Keep uncertainty ranges and alternative fits attached to any summary or exported plot.
Lab notes
- The activity table is a qualitative synthetic exercise. Do not quote its entries as JWST measurements, detection significance, chemical abundance or a real atmospheric retrieval.
- Transmission spectra sample the planet's observed limb and can average morning/evening regions; clouds, hazes, stellar heterogeneity, instrument systematics and wavelength coverage affect interpretation.
- A molecule detection is not evidence of life by itself. Consider abiotic chemistry, stellar radiation, temperature, pressure, context and independent observations before any habitability claim.
Variables
Independent: Synthetic atmospheric interpretation case and its measurement uncertainty · Dependent: Strength and scope of the claim a reader can justify from the plotted spectral evidence
Keep constant: Use the same wavelength axis, baseline convention, feature-detection rule and claim-evidence-limit rubric across all three invented cases
Procedure
- Label the exercise as synthetic: Use the three teaching cases and values in the table; they are invented, not measurements from JWST or a named exoplanet. Read the uncertainty column before naming any feature. The task is to practice evidence strength and alternative explanations, not to identify a real atmosphere from classroom numbers.
- Connect the observation to its geometry: For a transmission spectrum, compare starlight measured outside transit with starlight filtered through the planet's atmospheric limb during transit. Different wavelengths can be blocked by different amounts. The result primarily samples the terminator region along the observed chord; it does not directly map the whole atmosphere, surface, oceans, weather or night side.
- Check whether features exceed uncertainty: Plot normalized transit depth against wavelength with the stated uncertainty range. Mark a feature only if its shape and size are distinguishable from the uncertainty and baseline variation, and look for a coherent pattern across more than one wavelength. Do not treat a single point as a molecule identification. Compare the whole feature pattern with reference spectra and the instrument's wavelength coverage.
- Compare more than one atmosphere model: Use the three cases to test whether a similar-looking spectrum could fit different atmospheric stories. A muted or nearly flat spectrum may arise from high clouds or haze, a small atmospheric scale height or molecular weight, weak absorption, low signal-to-noise, limited wavelength coverage, or little/no atmosphere. Model assumptions and priors affect the retrieval; a good fit is not proof that only one composition exists.
- Read recent JWST evidence in context: In July 2026, NASA reported that Webb's NIRSpec spectra revealed carbon-monoxide absorption from directly imaged Beta Pictoris d; additional MIRI observations found water vapor and methane. Spectral lines helped separate the planet from dust and supported estimates of its motion, while separate imaging observations independently confirmed the planet. That is a specific young giant-planet case, not a recipe that every spectrum alone confirms every world.
- Write a claim with the missing evidence: State the feature observed, the wavelengths and uncertainty, the retrieval assumptions, and at least one plausible alternative. Then distinguish composition from climate, surface conditions and biology. A gas detection alone does not establish liquid surface water, habitability or life; those conclusions require multiple independent lines of evidence and a physically plausible planetary and stellar context.
Record your observations
| Synthetic case | Illustrative feature pattern | Stated uncertainty | Strongest defensible claim | One live alternative |
|---|---|---|---|---|
Observation, interpretation and overclaim are different steps
| Step | Careful statement | What it does not establish by itself |
|---|---|---|
A transmission spectrum sees a narrow atmospheric path
| Method | Light measured | Main information | Key limit |
|---|---|---|---|
Answer key and expected pattern
The structured synthetic spectrum supports a more specific molecule-related claim than the flat case only if features exceed their stated uncertainty and remain coherent with reference bands.
A flat or overlapping spectrum can leave multiple atmospheric explanations open; nondetection is not automatically evidence that no atmosphere exists.
Even an atmospheric molecule detection cannot by itself establish climate, surface habitability or life. State method, target geometry, wavelength coverage, uncertainty and model assumptions.
Remember: A spectrum can hint at atmospheric ingredients, but the answer depends on which wavelengths were measured and which models still fit. Describe the spectral feature and uncertainty first, compare plausible retrieval models second, and separate those results from claims about a planet's surface or life.